
Summary
This is a working log of the installation of kube-state-metrics, cAdvisor, and Prometheus on a Kubernetes cluster.
- Create a single-node Kubernetes cluster with kind
- Install kube-state-metrics as a Deployment
- Install cAdvisor as a DaemonSet
- Install Prometheus as a Deployment and configure it to scrape these metrics
Prerequisites
- kind v0.17.0 go1.19.2 darwin/arm64
- kubernetes v1.25.3
- kubectl v1.25.0
- prometheus version 2.40.3
- kube-state-metrics v2.7.0
- cAdvisor v0.45.0
Logs
Create a Kubernetes cluster
Let’s go with kind.
$ kind create cluster

Creating cluster "kind" ...
 ✓ Ensuring node image (kindest/node:v1.25.3) 🖼
 ✓ Preparing nodes 📦
 ✓ Writing configuration 📜
 ✓ Starting control-plane 🕹️
 ✓ Installing CNI 🔌
 ✓ Installing StorageClass 💾
Set kubectl context to "kind-kind"
You can now use your cluster with:

kubectl cluster-info --context kind-kind

Have a question, bug, or feature request? Let us know! https://kind.sigs.k8s.io/#community 🙂
Install kube-state-metrics
kube-state-metrics generates the metrics of Kubernetes objects such as Nodes, Services and Pods.
You can install it using the sample manifests.
$ kubectl apply -f https://raw.githubusercontent.com/kubernetes/kube-state-metrics/master/examples/standard/service-account.yaml && \
  kubectl apply -f https://raw.githubusercontent.com/kubernetes/kube-state-metrics/master/examples/standard/cluster-role.yaml && \
  kubectl apply -f https://raw.githubusercontent.com/kubernetes/kube-state-metrics/master/examples/standard/cluster-role-binding.yaml && \
  kubectl apply -f https://raw.githubusercontent.com/kubernetes/kube-state-metrics/master/examples/standard/deployment.yaml && \
  kubectl apply -f https://raw.githubusercontent.com/kubernetes/kube-state-metrics/master/examples/standard/service.yaml

serviceaccount/kube-state-metrics created
clusterrole.rbac.authorization.k8s.io/kube-state-metrics created
clusterrolebinding.rbac.authorization.k8s.io/kube-state-metrics created
deployment.apps/kube-state-metrics created
service/kube-state-metrics created
In this case, kube-state-metrics is run as a Deployment.
Let’s port-forward to this Service and check the metrics.
$ kubectl -n kube-system get deploy,service -l app.kubernetes.io/name=kube-state-metrics

NAME                                 READY   UP-TO-DATE   AVAILABLE   AGE
deployment.apps/kube-state-metrics   1/1     1            1           115s

NAME                         TYPE        CLUSTER-IP   EXTERNAL-IP   PORT(S)             AGE
service/kube-state-metrics   ClusterIP   None         <none>        8080/TCP,8081/TCP   115s

$ kubectl -n kube-system port-forward service/kube-state-metrics 8080:8080 8081:8081
Forwarding from 127.0.0.1:8080 -> 8080
Forwarding from [::1]:8080 -> 8080
Forwarding from 127.0.0.1:8081 -> 8081
Forwarding from [::1]:8081 -> 8081
...

# from different terminal
$ curl localhost:8080/metrics
...
# HELP kube_configmap_labels [STABLE] Kubernetes labels converted to Prometheus labels.
# TYPE kube_configmap_labels gauge
kube_configmap_labels{namespace="local-path-storage",configmap="local-path-config"} 1
kube_configmap_labels{namespace="default",configmap="kube-root-ca.crt"} 1
...
Good. It works fine.
The docs has more information about the metrics.
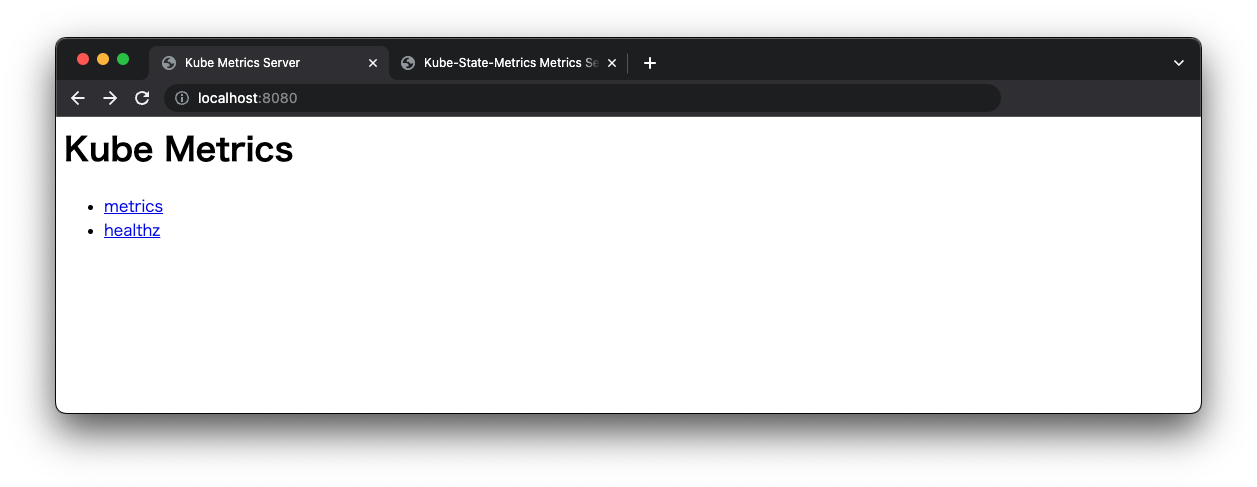
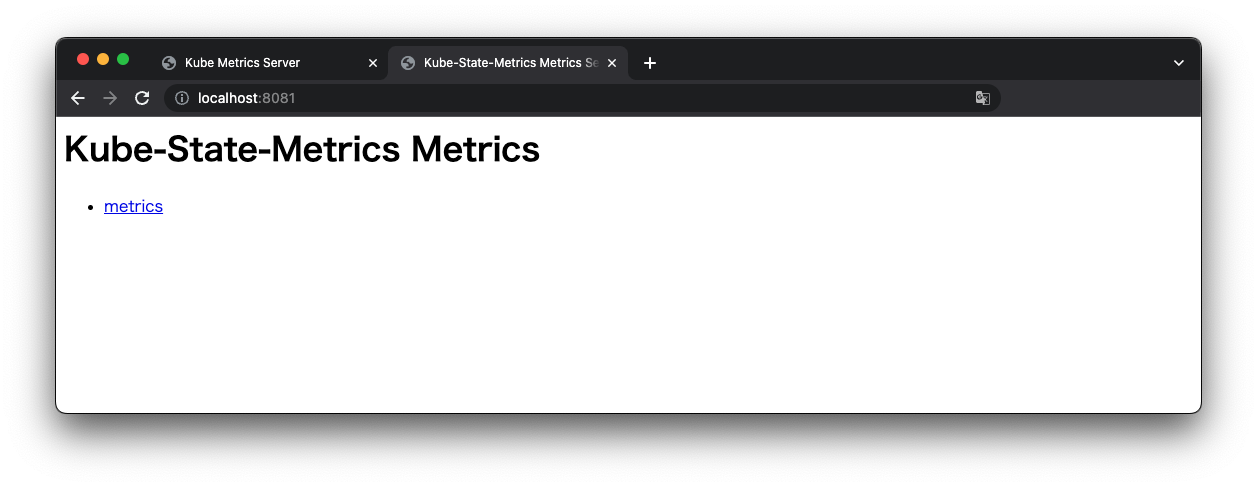
kube-state-metrics can also be accessed via a browser.
Install cAdvisor
cAdvisor exports the container metrics such as CPU usage, Memory usage, etc.
Kustomized manifests are available. Yes!
$ kubectl apply -k https://github.com/google/cadvisor//deploy/kubernetes/base

namespace/cadvisor created
serviceaccount/cadvisor created
daemonset.apps/cadvisor created
cAdvisor runs as a DaemonSet and collects container information from each Node.
$ kubectl -n cadvisor get daemonset -l app=cadvisor

NAME       DESIRED   CURRENT   READY   UP-TO-DATE   AVAILABLE   NODE SELECTOR   AGE
cadvisor   1         1         1       1            1           <none>          6m54s

$ pod=`kubectl -n cadvisor get pod -l app=cadvisor -o jsonpath="{.items[0].metadata.name}"`
$ kubectl -n cadvisor port-forward pod/"${pod}" 8080:8080

Forwarding from 127.0.0.1:8080 -> 8080
Forwarding from [::1]:8080 -> 8080

# from different terminal
$ curl localhost:8080/metrics

# HELP cadvisor_version_info A metric with a constant '1' value labeled by kernel version, OS version, docker version, cadvisor version & cadvisor revision.
# TYPE cadvisor_version_info gauge
cadvisor_version_info{cadvisorRevision="86b11c65",cadvisorVersion="v0.45.0",dockerVersion="",kernelVersion="5.10.124-linuxkit",osVersion="Alpine Linux v3.16"} 1
# HELP container_blkio_device_usage_total Blkio Device bytes usage
# TYPE container_blkio_device_usage_total counter
container_blkio_device_usage_total{container_label_app="",container_label_app_kubernetes_io_component="",container_label_app_kubernetes_io_name="",container_label_app_kubernetes_io_version="",container_label_component="",container_label_controller_revision_hash="",container_label_description="",container_label_io_cri_containerd_kind="",container_label_io_kubernetes_container_name="",container_label_io_kubernetes_pod_name="",container_label_io_kubernetes_pod_namespace="",container_label_io_kubernetes_pod_uid="",container_label_k8s_app="",container_label_maintainers="",container_label_name="",container_label_pod_template_generation="",container_label_pod_template_hash="",container_label_tier="",device="/dev/vda",id="/",image="",major="254",minor="0",name="",operation="Read"} 0 1669642901054
...
Metrics with names like container_** are container metrics.
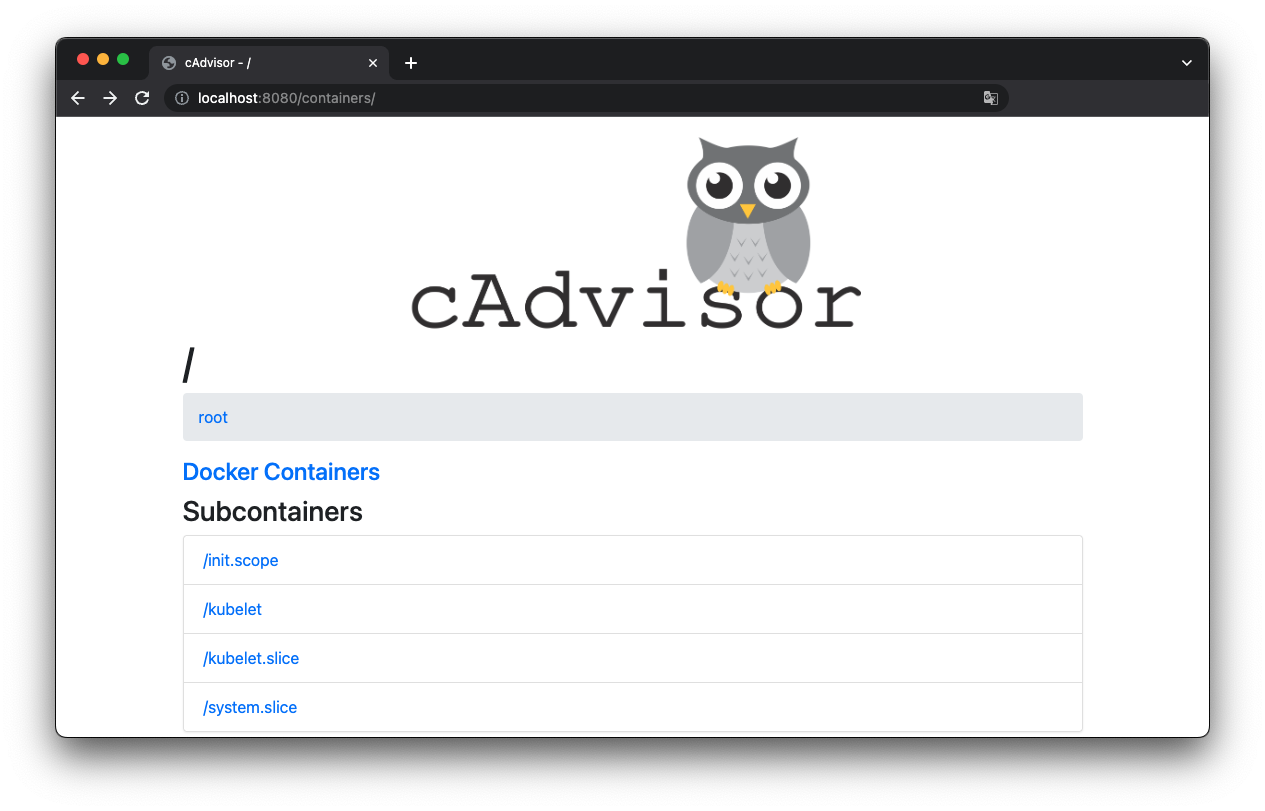
Of course, cAdvisor can also be accessed via a browser.
Install Prometheus
Next, install Prometheus to scrape these metrics.
Here is an example manifest that installs Prometheus as a Deployment.
Apply it.
$ kubectl create namespace prometheus

namespace/prometheus created

$ kubectl -n prometheus apply -f deployment.yaml

deployment.apps/prometheus created

$ kubectl -n prometheus expose deployment prometheus --port=9090 --target-port=9090

service/prometheus exposed
Make sure it is working properly.
$ kubectl -n prometheus port-forward service/prometheus 9090:9090

Forwarding from 127.0.0.1:9090 -> 9090
Forwarding from [::1]:9090 -> 9090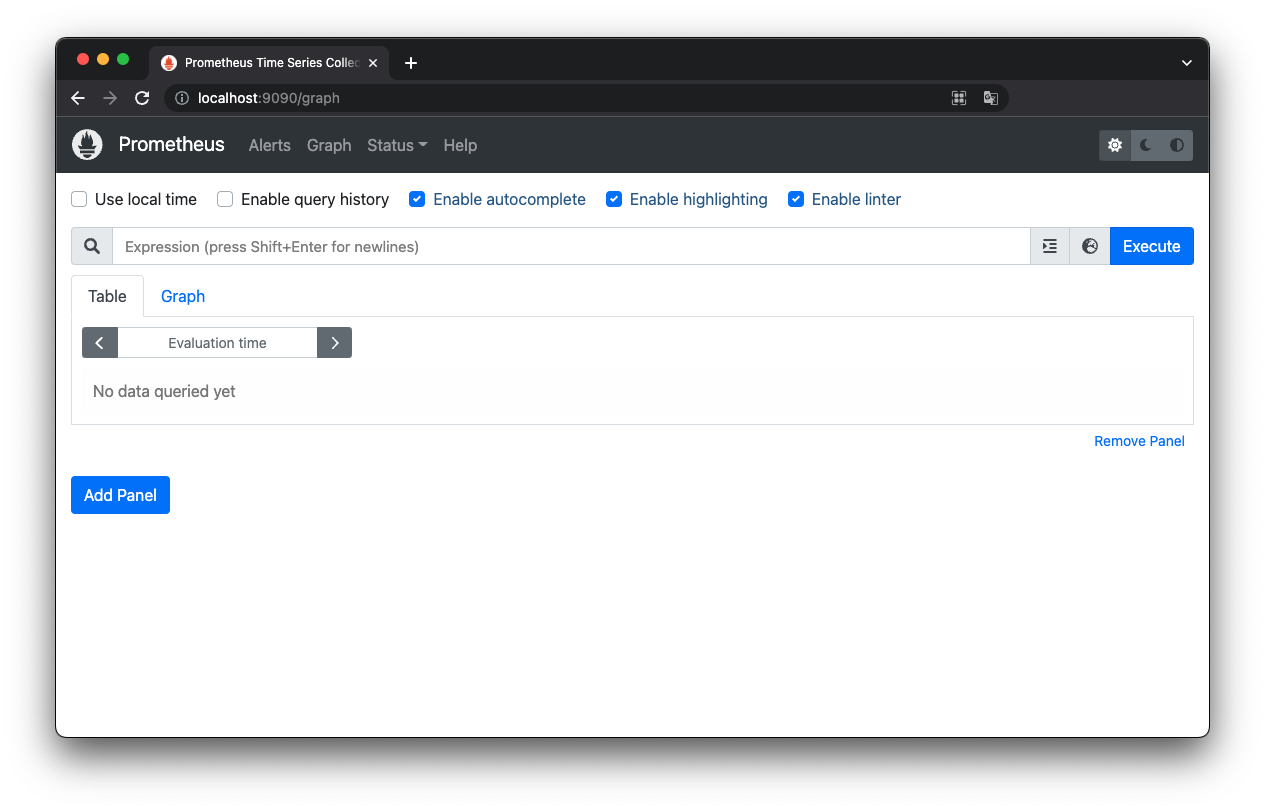
Good.
Configure Prometheus for service discovery (kubernetes_sd_config)
Finally, configure Prometheus to scrape metrics in the cluster.
kubernetes_sd_config is the key.
Follow the example and create prometheus.yml.
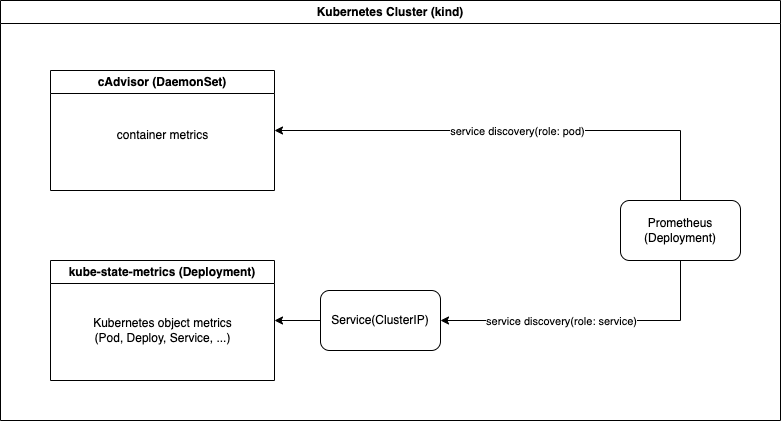
In this case, Prometheus scrapes only Services of kube-state-metrics and Pods of cAdvisor.
(Without this config, kube-state-metrics is scraped by both “role: service” job and “role: pod” job, then the metrics are duplicated.)
$ kubectl -n cadvisor get pods --show-labels

NAME             READY   STATUS    RESTARTS   AGE   LABELS
cadvisor-fngj6   1/1     Running   0          23h   app=cadvisor,controller-revision-hash=df8bf66b4,name=cadvisor,pod-template-generation=1

$ kubectl -n kube-system get service kube-state-metrics --show-labels

NAME                 TYPE        CLUSTER-IP   EXTERNAL-IP   PORT(S)             AGE   LABELS
kube-state-metrics   ClusterIP   None         <none>        8080/TCP,8081/TCP   24h   app.kubernetes.io/component=exporter,app.kubernetes.io/name=kube-state-metrics,app.kubernetes.io/version=2.7.0

$ kubectl apply -f configmap.yaml

configmap/prometheus-config created
Update the Deployment to load the config.
$ kubectl apply -f deployment.yaml

deployment.apps/prometheus configured
Open Status->Service Discovery to check operation.
http://localhost:9090/service-discovery
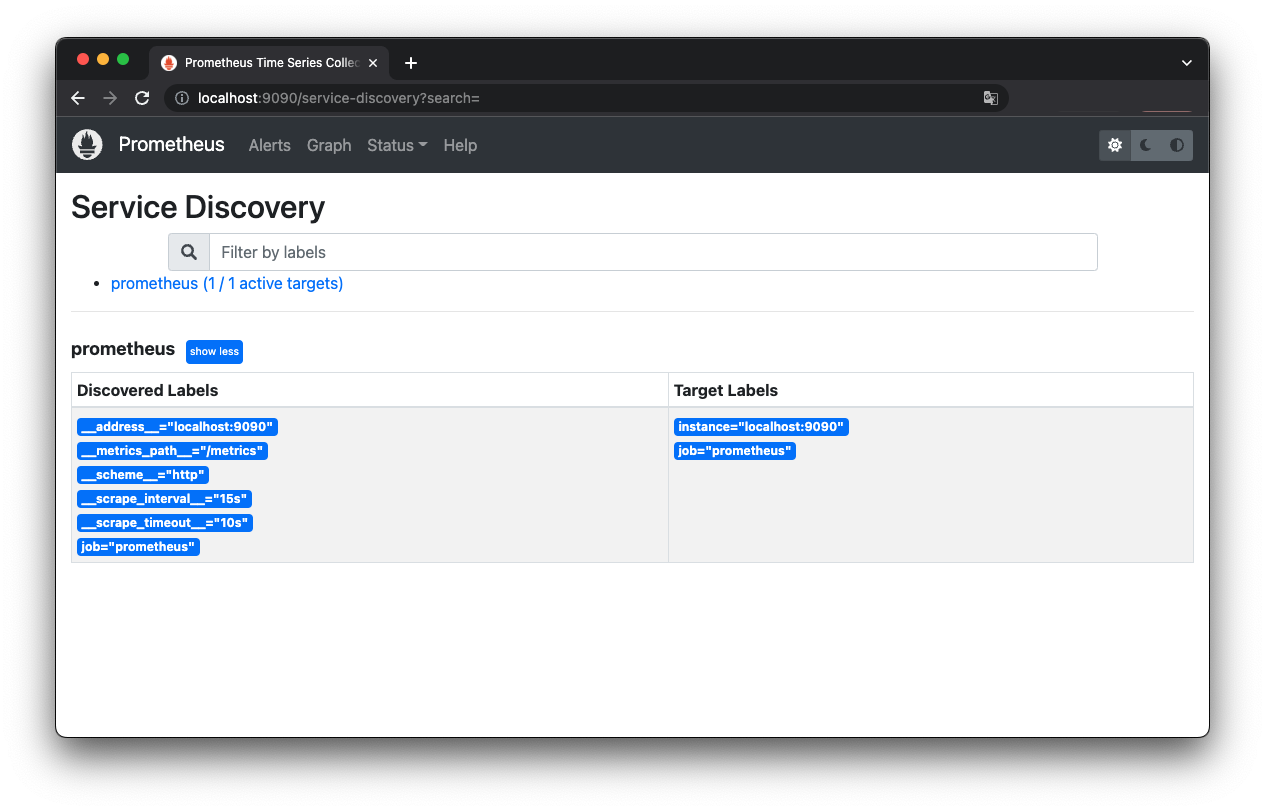
Oops! Service discovery has failed.
Check the Pod log…
$ pod=`kubectl -n prometheus get pods -l app=prometheus -o jsonpath="{.items[0].metadata.name}"`
$ kubectl -n prometheus logs $pod

...
ts=2022-11-28T14:26:56.150Z caller=kubernetes.go:326 level=info component="discovery manager scrape" discovery=kubernetes msg="Using pod service account via in-cluster config"
ts=2022-11-28T14:26:56.150Z caller=main.go:1234 level=info msg="Completed loading of configuration file" filename=/config/prometheus.yml totalDuration=2.798834ms db_storage=1.208µs remote_storage=1.417µs web_handler=375ns query_engine=1.042µs scrape=250.917µs scrape_sd=2.159042ms notify=1.083µs notify_sd=5.709µs rules=1.584µs tracing=12.958µs
ts=2022-11-28T14:26:56.150Z caller=main.go:978 level=info msg="Server is ready to receive web requests."
ts=2022-11-28T14:26:56.150Z caller=manager.go:944 level=info component="rule manager" msg="Starting rule manager..."
ts=2022-11-28T14:26:56.156Z caller=klog.go:108 level=warn component=k8s_client_runtime func=Warningf msg="pkg/mod/k8s.io/[email protected]/tools/cache/reflector.go:169: failed to list *v1.Service: services is forbidden: User \"system:serviceaccount:prometheus:default\" cannot list resource \"services\" in API group \"\" at the cluster scope"
ts=2022-11-28T14:26:56.156Z caller=klog.go:108 level=warn component=k8s_client_runtime func=Warningf msg="pkg/mod/k8s.io/[email protected]/tools/cache/reflector.go:169: failed to list *v1.Pod: pods is forbidden: User \"system:serviceaccount:prometheus:default\" cannot list resource \"pods\" in API group \"\" at the cluster scope"
ts=2022-11-28T14:26:56.156Z caller=klog.go:116 level=error component=k8s_client_runtime func=ErrorDepth msg="pkg/mod/k8s.io/[email protected]/tools/cache/reflector.go:169: Failed to watch *v1.Service: failed to list *v1.Service: services is forbidden: User \"system:serviceaccount:prometheus:default\" cannot list resource \"services\" in API group \"\" at the cluster scope"
ts=2022-11-28T14:26:56.156Z caller=klog.go:108 level=warn component=k8s_client_runtime func=Warningf msg="pkg/mod/k8s.io/[email protected]/tools/cache/reflector.go:169: failed to list *v1.Endpoints: endpoints is forbidden: User \"system:serviceaccount:prometheus:default\" cannot list resource \"endpoints\" in API group \"\" at the cluster scope"
ts=2022-11-28T14:26:56.156Z caller=klog.go:116 level=error component=k8s_client_runtime func=ErrorDepth msg="pkg/mod/k8s.io/[email protected]/tools/cache/reflector.go:169: Failed to watch *v1.Endpoints: failed to list *v1.Endpoints: endpoints is forbidden: User \"system:serviceaccount:prometheus:default\" cannot list resource \"endpoints\" in API group \"\" at the cluster scope"
...
According to the log, Prometheus is failing to get information of Pods, Services and Endpoints because the default ServiceAccount is not authorized.
Then create ServiceAccount, ClusterRole and ClusterRoleBinding to gave permission.
$ kubectl -n prometheus create serviceaccount prometheus

serviceaccount/prometheus created

$ kubectl create clusterrole prometheus --verb=get,list,watch --resource=pods,services,endpoints

clusterrole.rbac.authorization.k8s.io/prometheus created

$ kubectl create clusterrolebinding prometheus --clusterrole=prometheus --serviceaccount=prometheus:prometheus

clusterrolebinding.rbac.authorization.k8s.io/prometheus created
Update the Deployment again.
$ kubectl apply -f deployment.yaml

deployment.apps/prometheus configured
This time it succeeded. Wow!
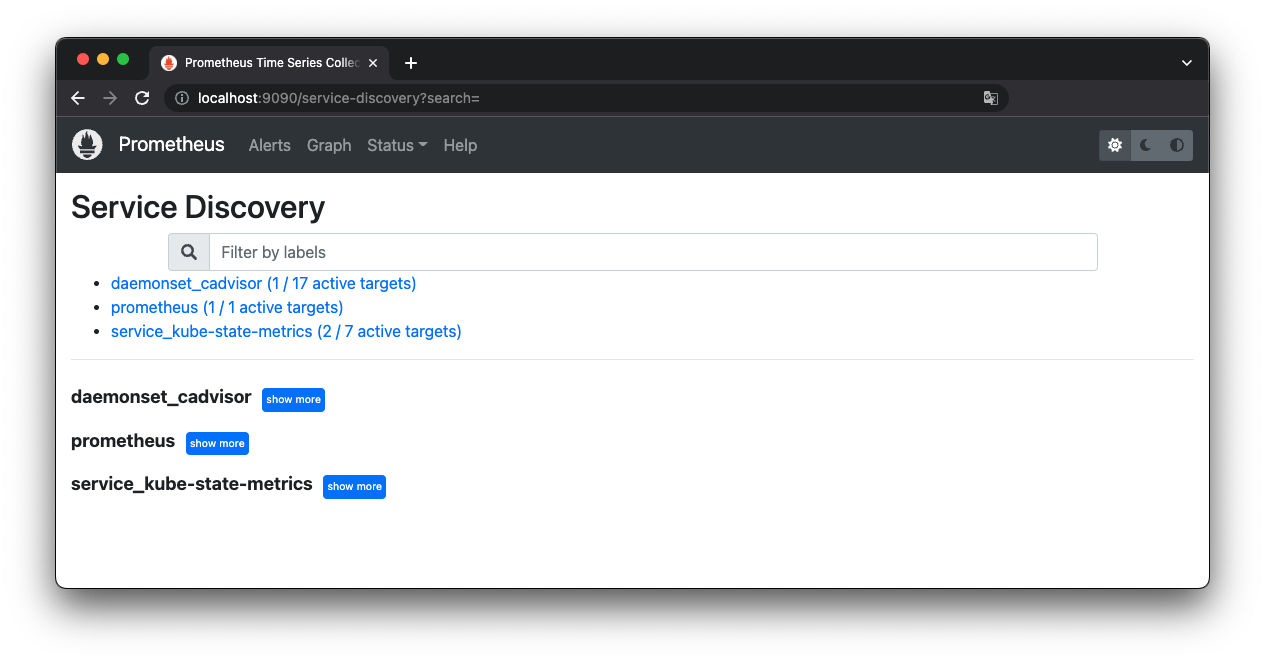
The metrics are correctly scraped.
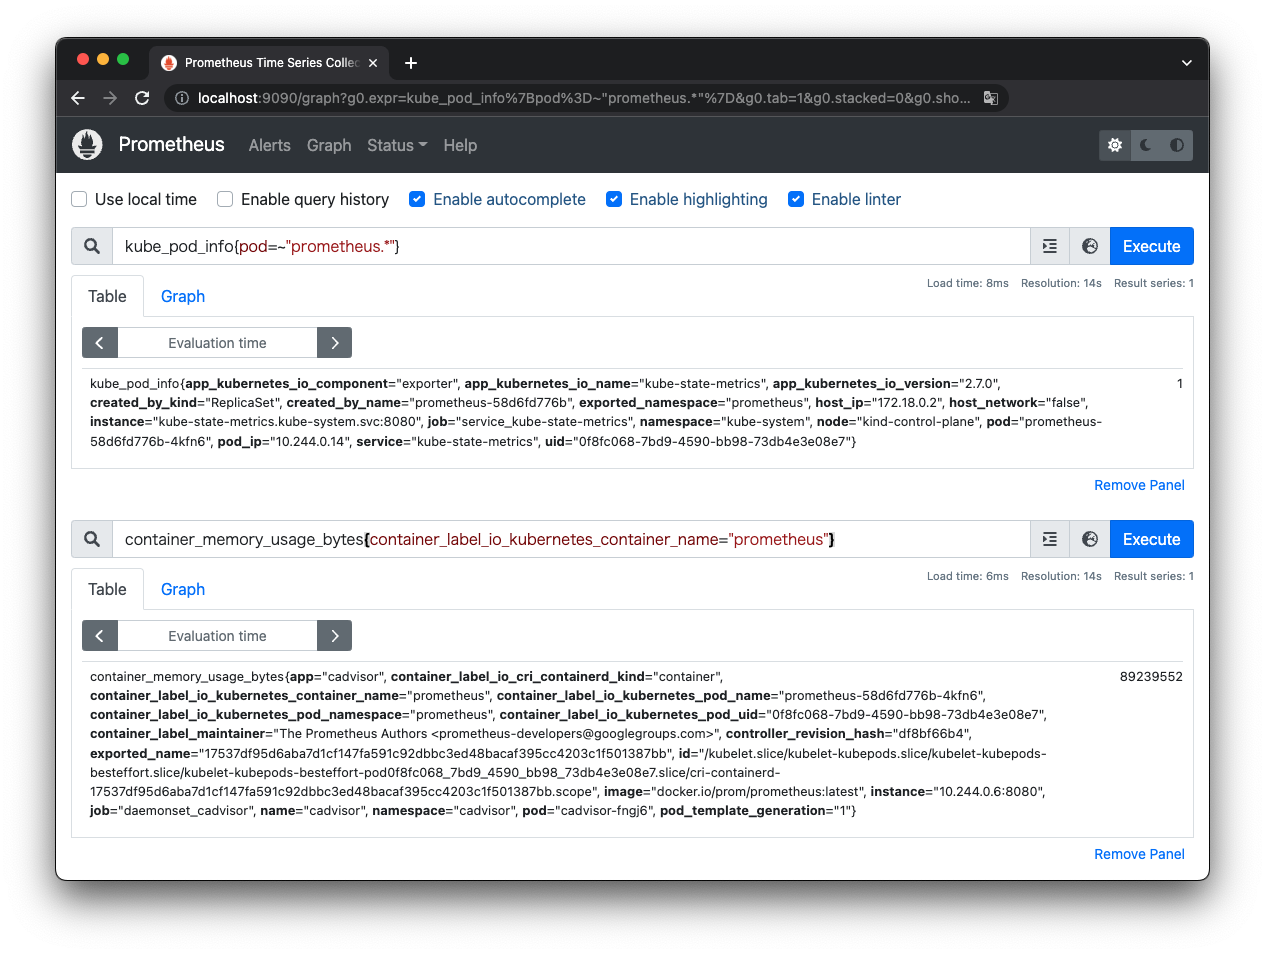
That is all.