自作Exporter
Prometheusでスクレイプする用のExporterを自作してみた.
やったことのまとめ
GoのPrometheusクライアント1を使って, 自分で設定したメトリクスを表示できるExporterを作成した- 作成した
ExporterとPrometheusをDockerで動かし, スクレイプできることを確認した
https://github.com/uzimihsr/example-exporter
つかうもの
- macOS Mojave 10.14
- go version go1.14.6 darwin/amd64
- prometheus/client_golang v1.7.1
- Docker Desktop for Mac 2.1.0.3
- Docker version 19.03.2
- docker-compose version 1.24.1
やったこと
Exporterの作成
# 作業用ディレクトリとgo.modの作成
$ pwd
/path/to/workspace
$ mkdir example-exporter && cd example-exporter
$ go mod init github.com/uzimihsr/example-exporter
go: creating new go.mod: module github.com/uzimihsr/example-exporter
$ touch main.gomain.goはこんな感じで作る.
書き方はDocsの例2とPrometheusクライアントのサンプルコード3を参考にした.
ポイントは/metricsへのリクエストをハンドリングする処理と別にgo routineを使ってメトリクスを更新する処理を入れているところ.
こうすることで各メトリクスが並行に更新され, リクエストが来るたびにメトリクスの最新の値を返すことができる.
試しに動かしてみる.
# exporterの実行
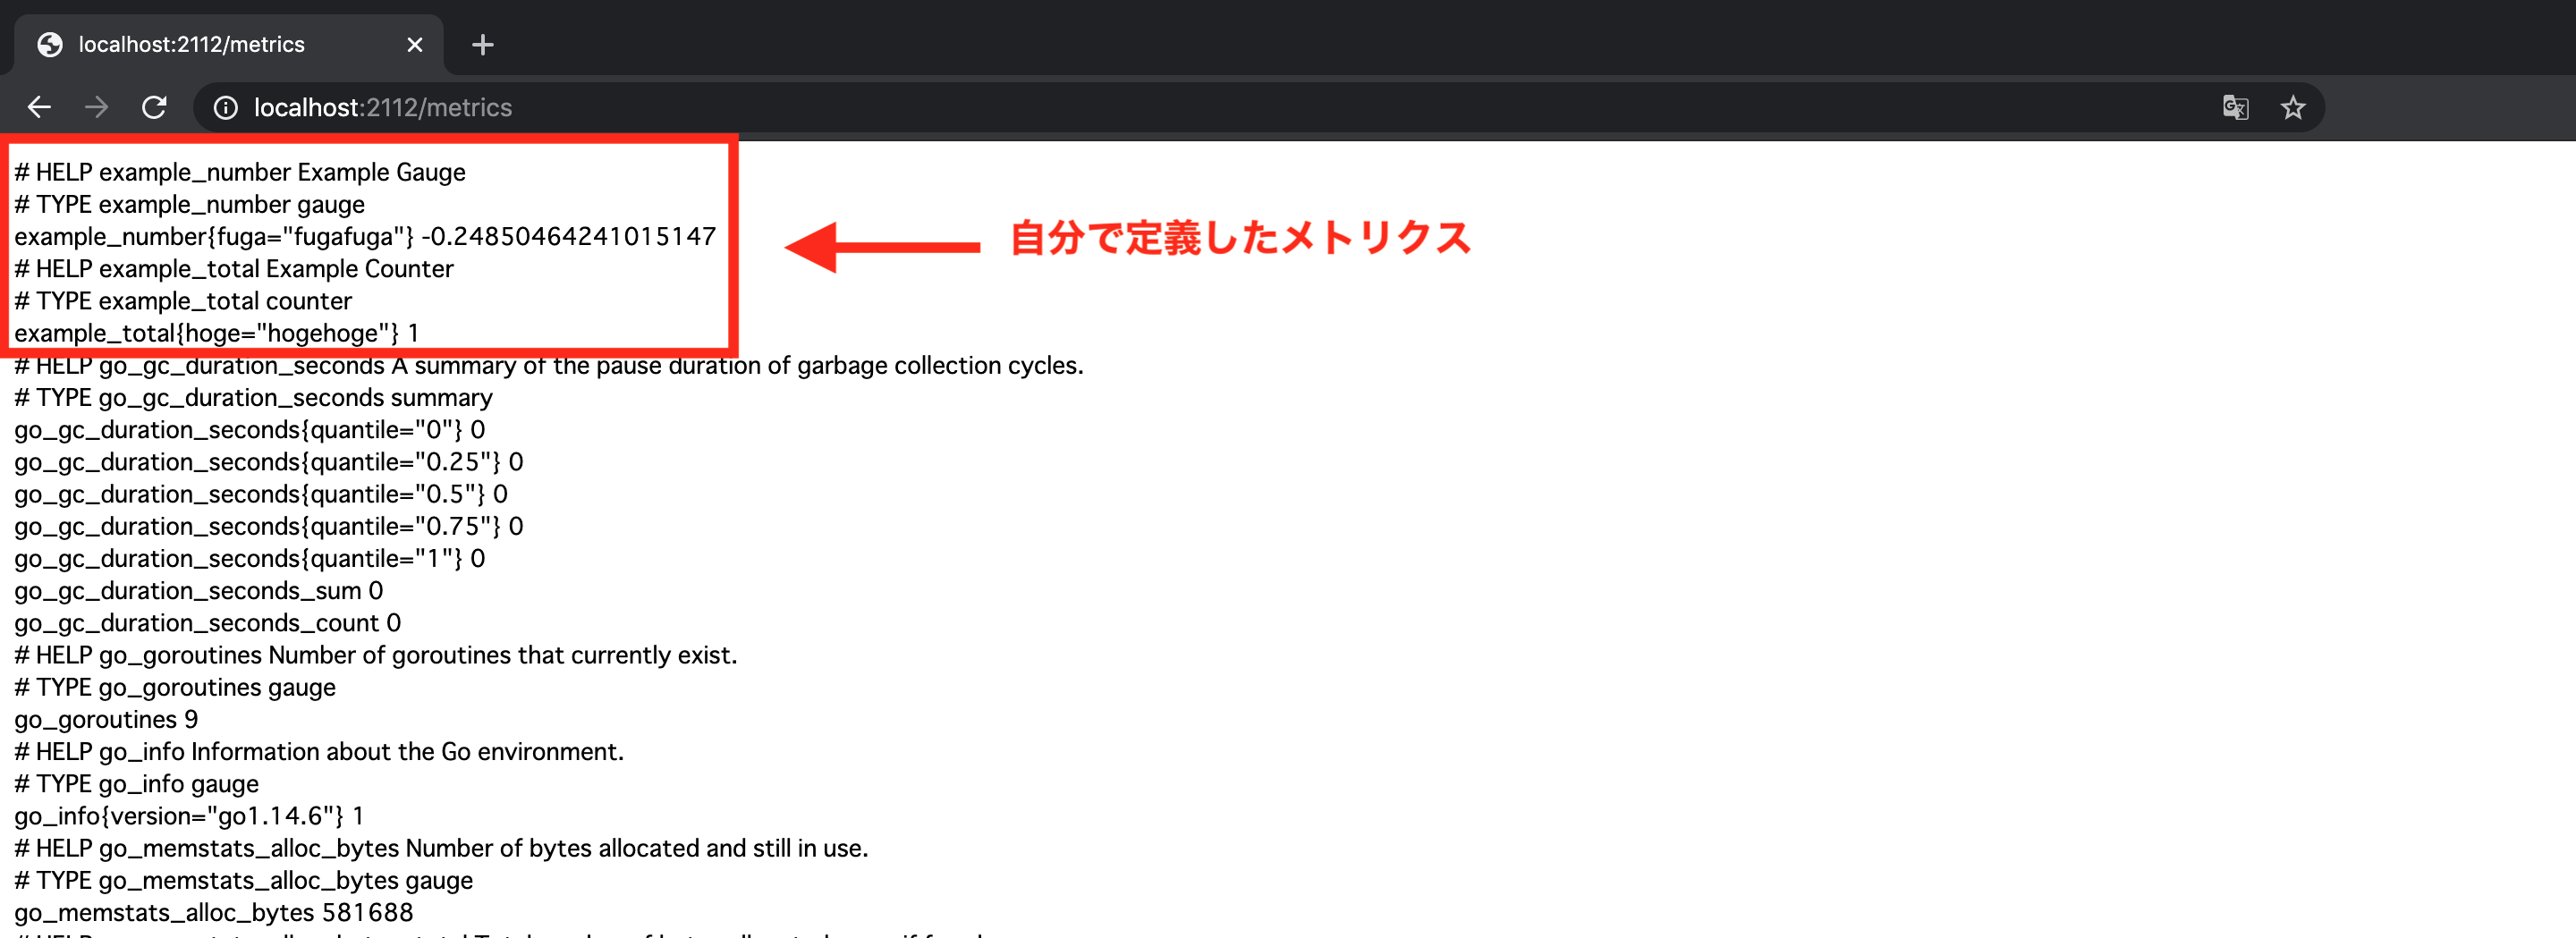
$ go run main.goブラウザで http://localhost:2112/metrics を開く.
こんな感じでPrometheusが読めるフォーマットのメトリクスが表示された.
メトリクス定義に記述したメトリクス名, 説明文, ラベルが反映されていることがわかる.
# HELP example_number Example Gauge
# TYPE example_number gauge
example_number{fuga="fugafuga"} -0.0056473753420378525
# HELP example_total Example Counter
# TYPE example_total counter
example_total{hoge="hogehoge"} 13
Prometheusでスクレイプ
せっかくなので, Prometheusでスクレイプしてみる.
今回は試しにDocker上でPrometheusのコンテナと今回作った example-exporter のコンテナを同時に動かす.
example-exporter 用のDockerfileの書き方はGoアプリをDockerのscratchイメージで動かすを参考にする.
さらにPrometheusの設定ファイルprometheus.ymlと,
2つのコンテナを動かすためにdocker-compose.ymlを作成する.
この状態でdocker-composeで2つのコンテナを起動する.
# ディレクトリの状態
$ tree .
.
├── Dockerfile
├── docker-compose.yml
├── go.mod
├── go.sum
├── main.go
└── prometheus.yml
# docker-composeでコンテナを起動
$ docker-compose up -d
Creating network "example-exporter_default" with the default driver
Creating example-exporter ... done
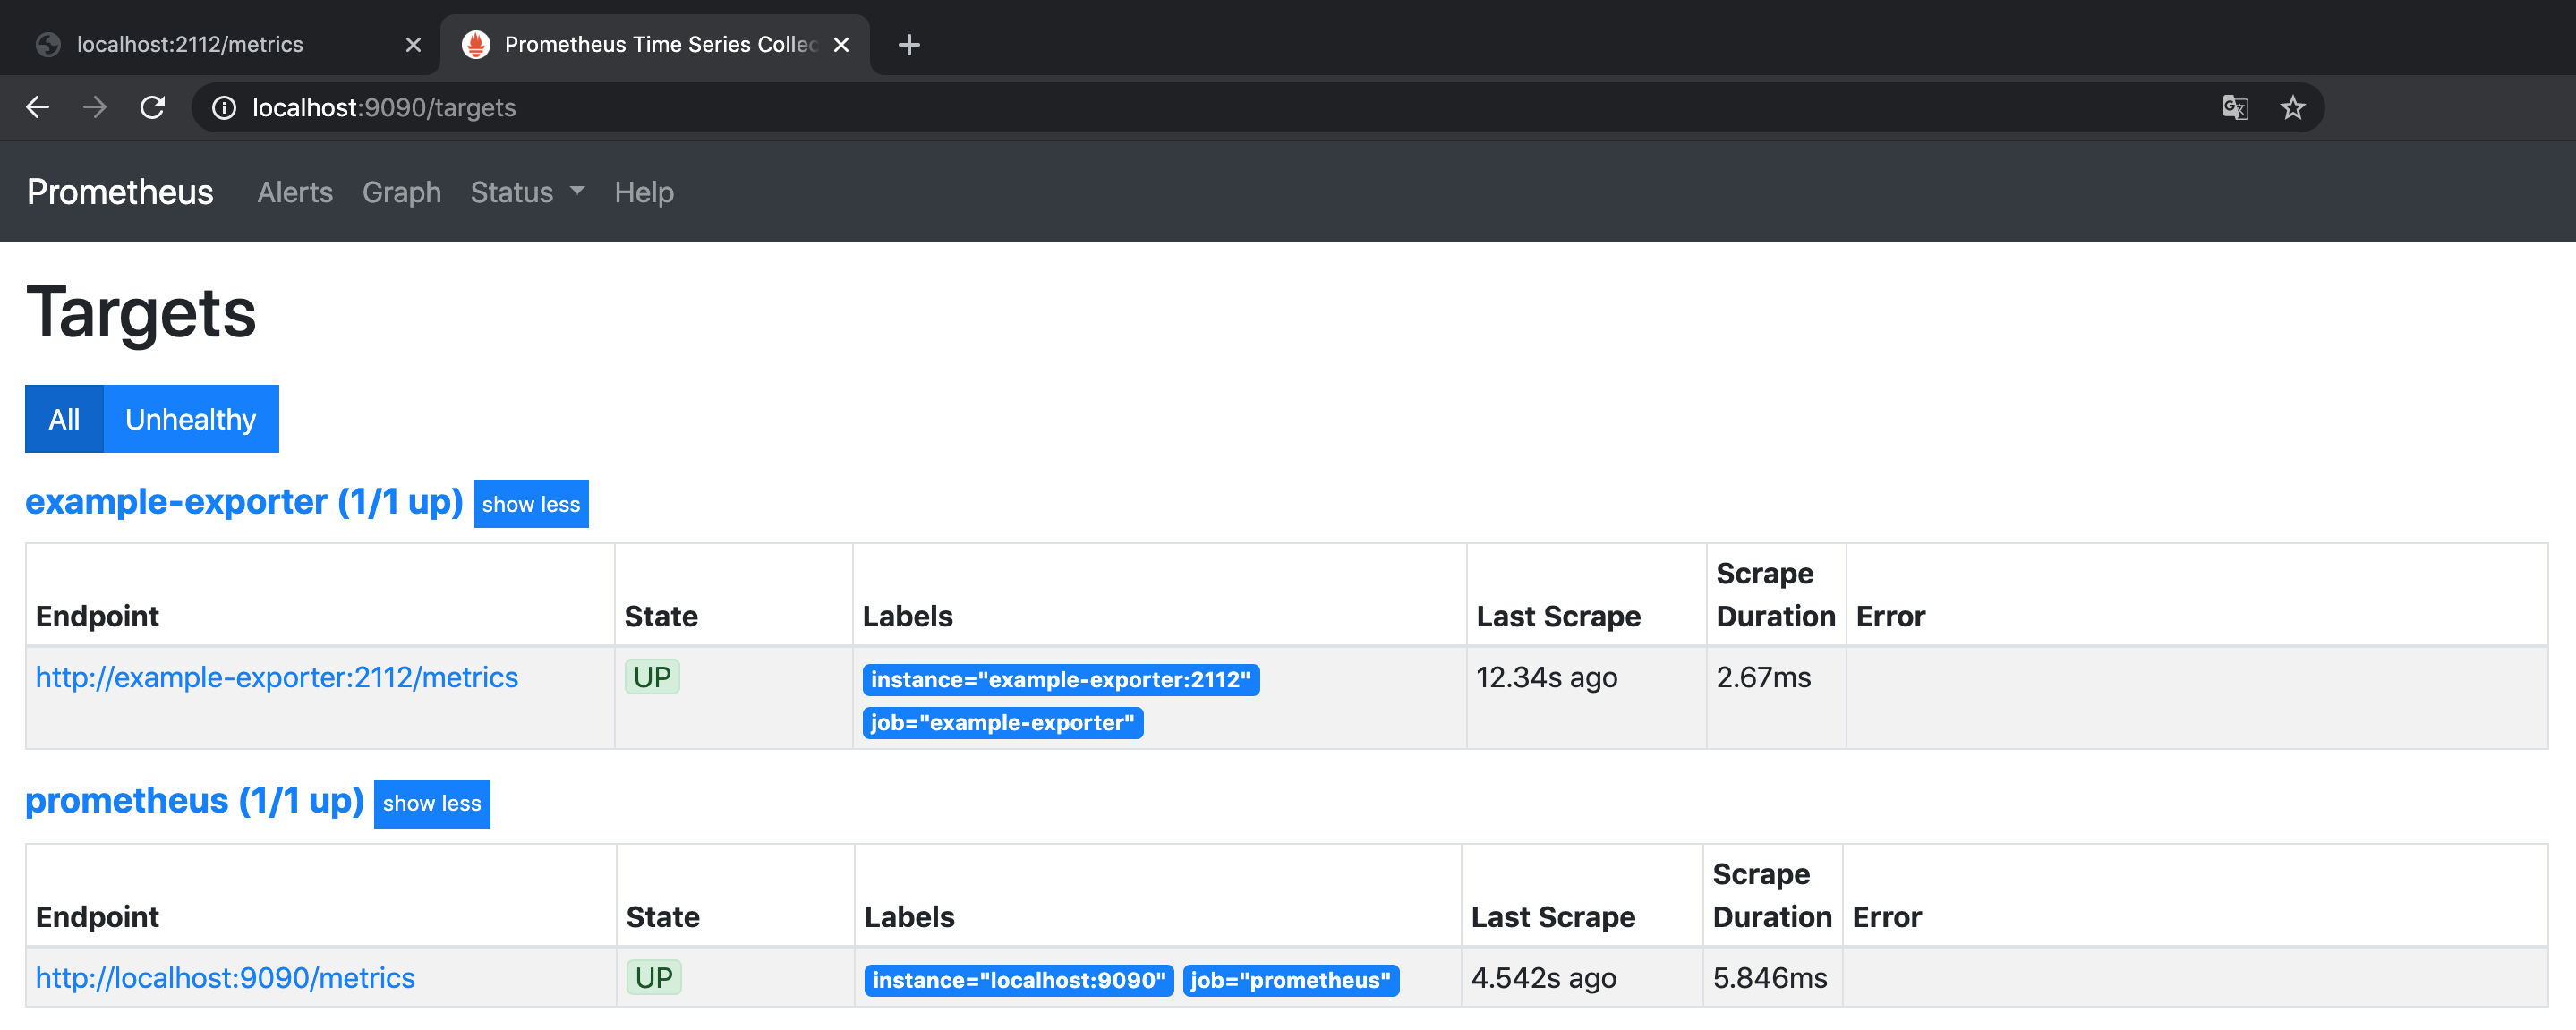
Creating prometheus ... doneコンテナが起動した状態で http://localhost:9090/graph をホストのブラウザで開くと, Prometheusの画面が表示される.
無事に起動できていれば example-exporter がスクレイプできている.
試しに example-exporter のメトリクス名でクエリを投げてみると, ちゃんと時系列の値が表示される.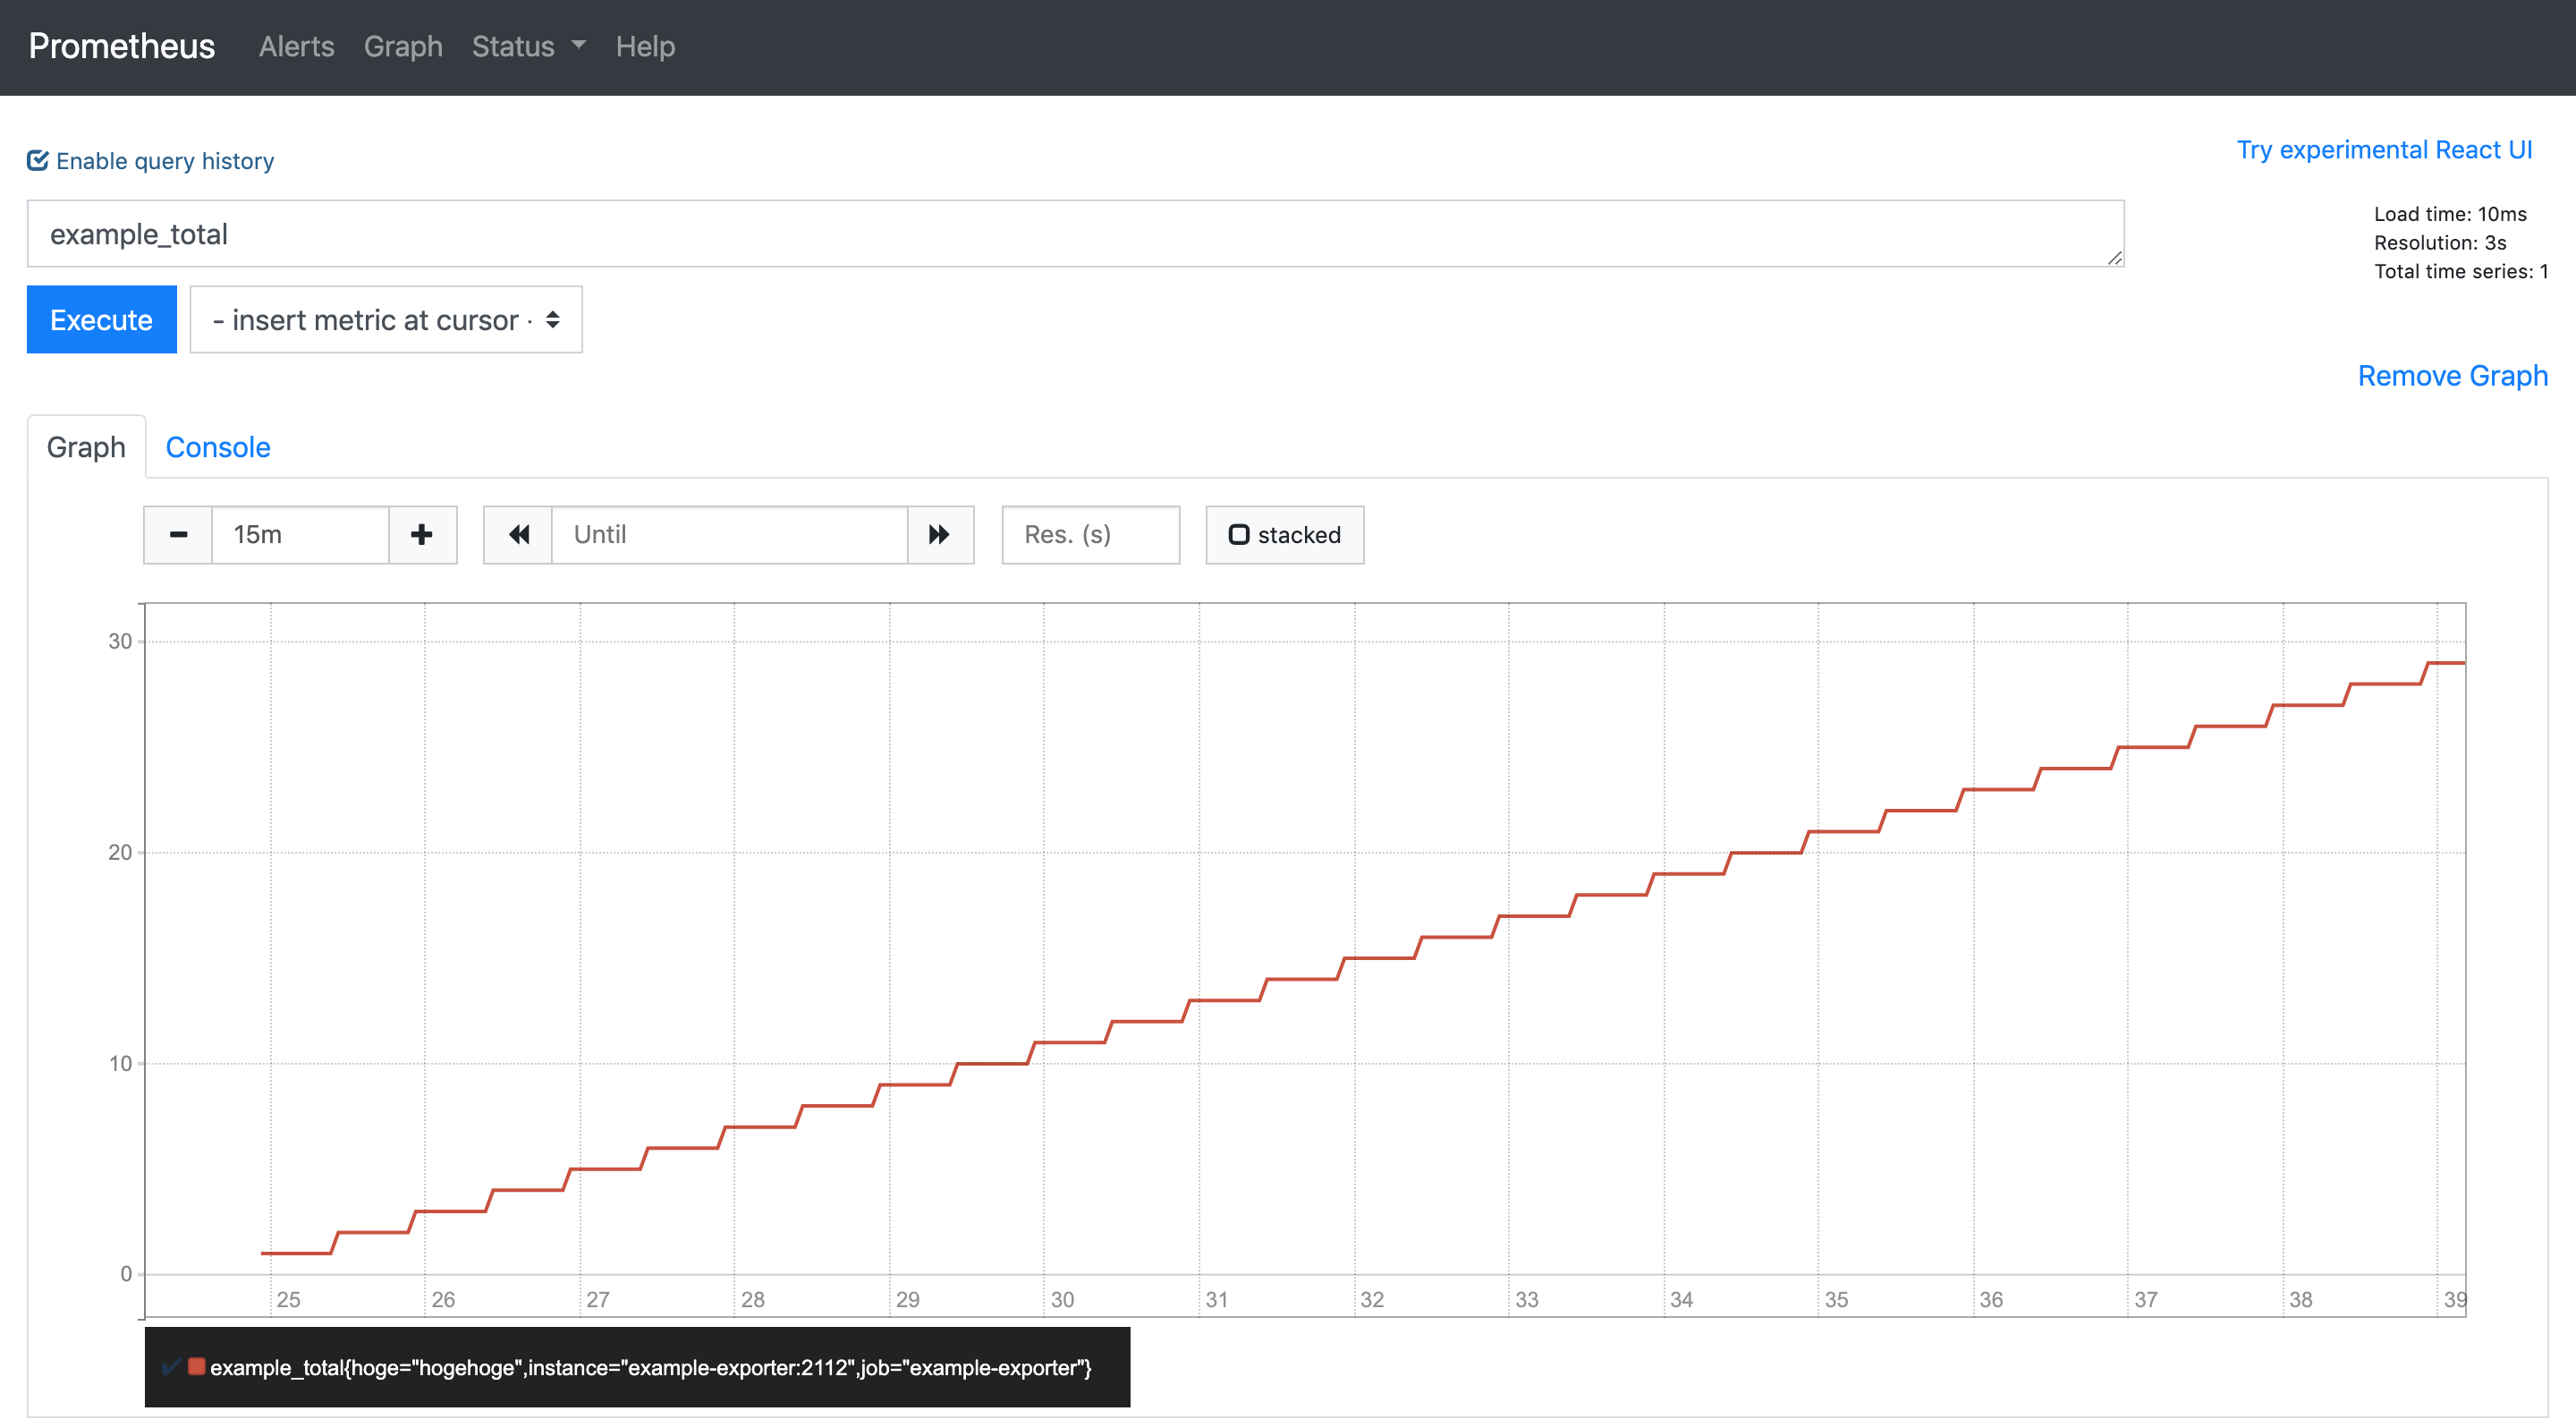
example_total はmain.goで設定した通り30秒ごとに値が加算され,
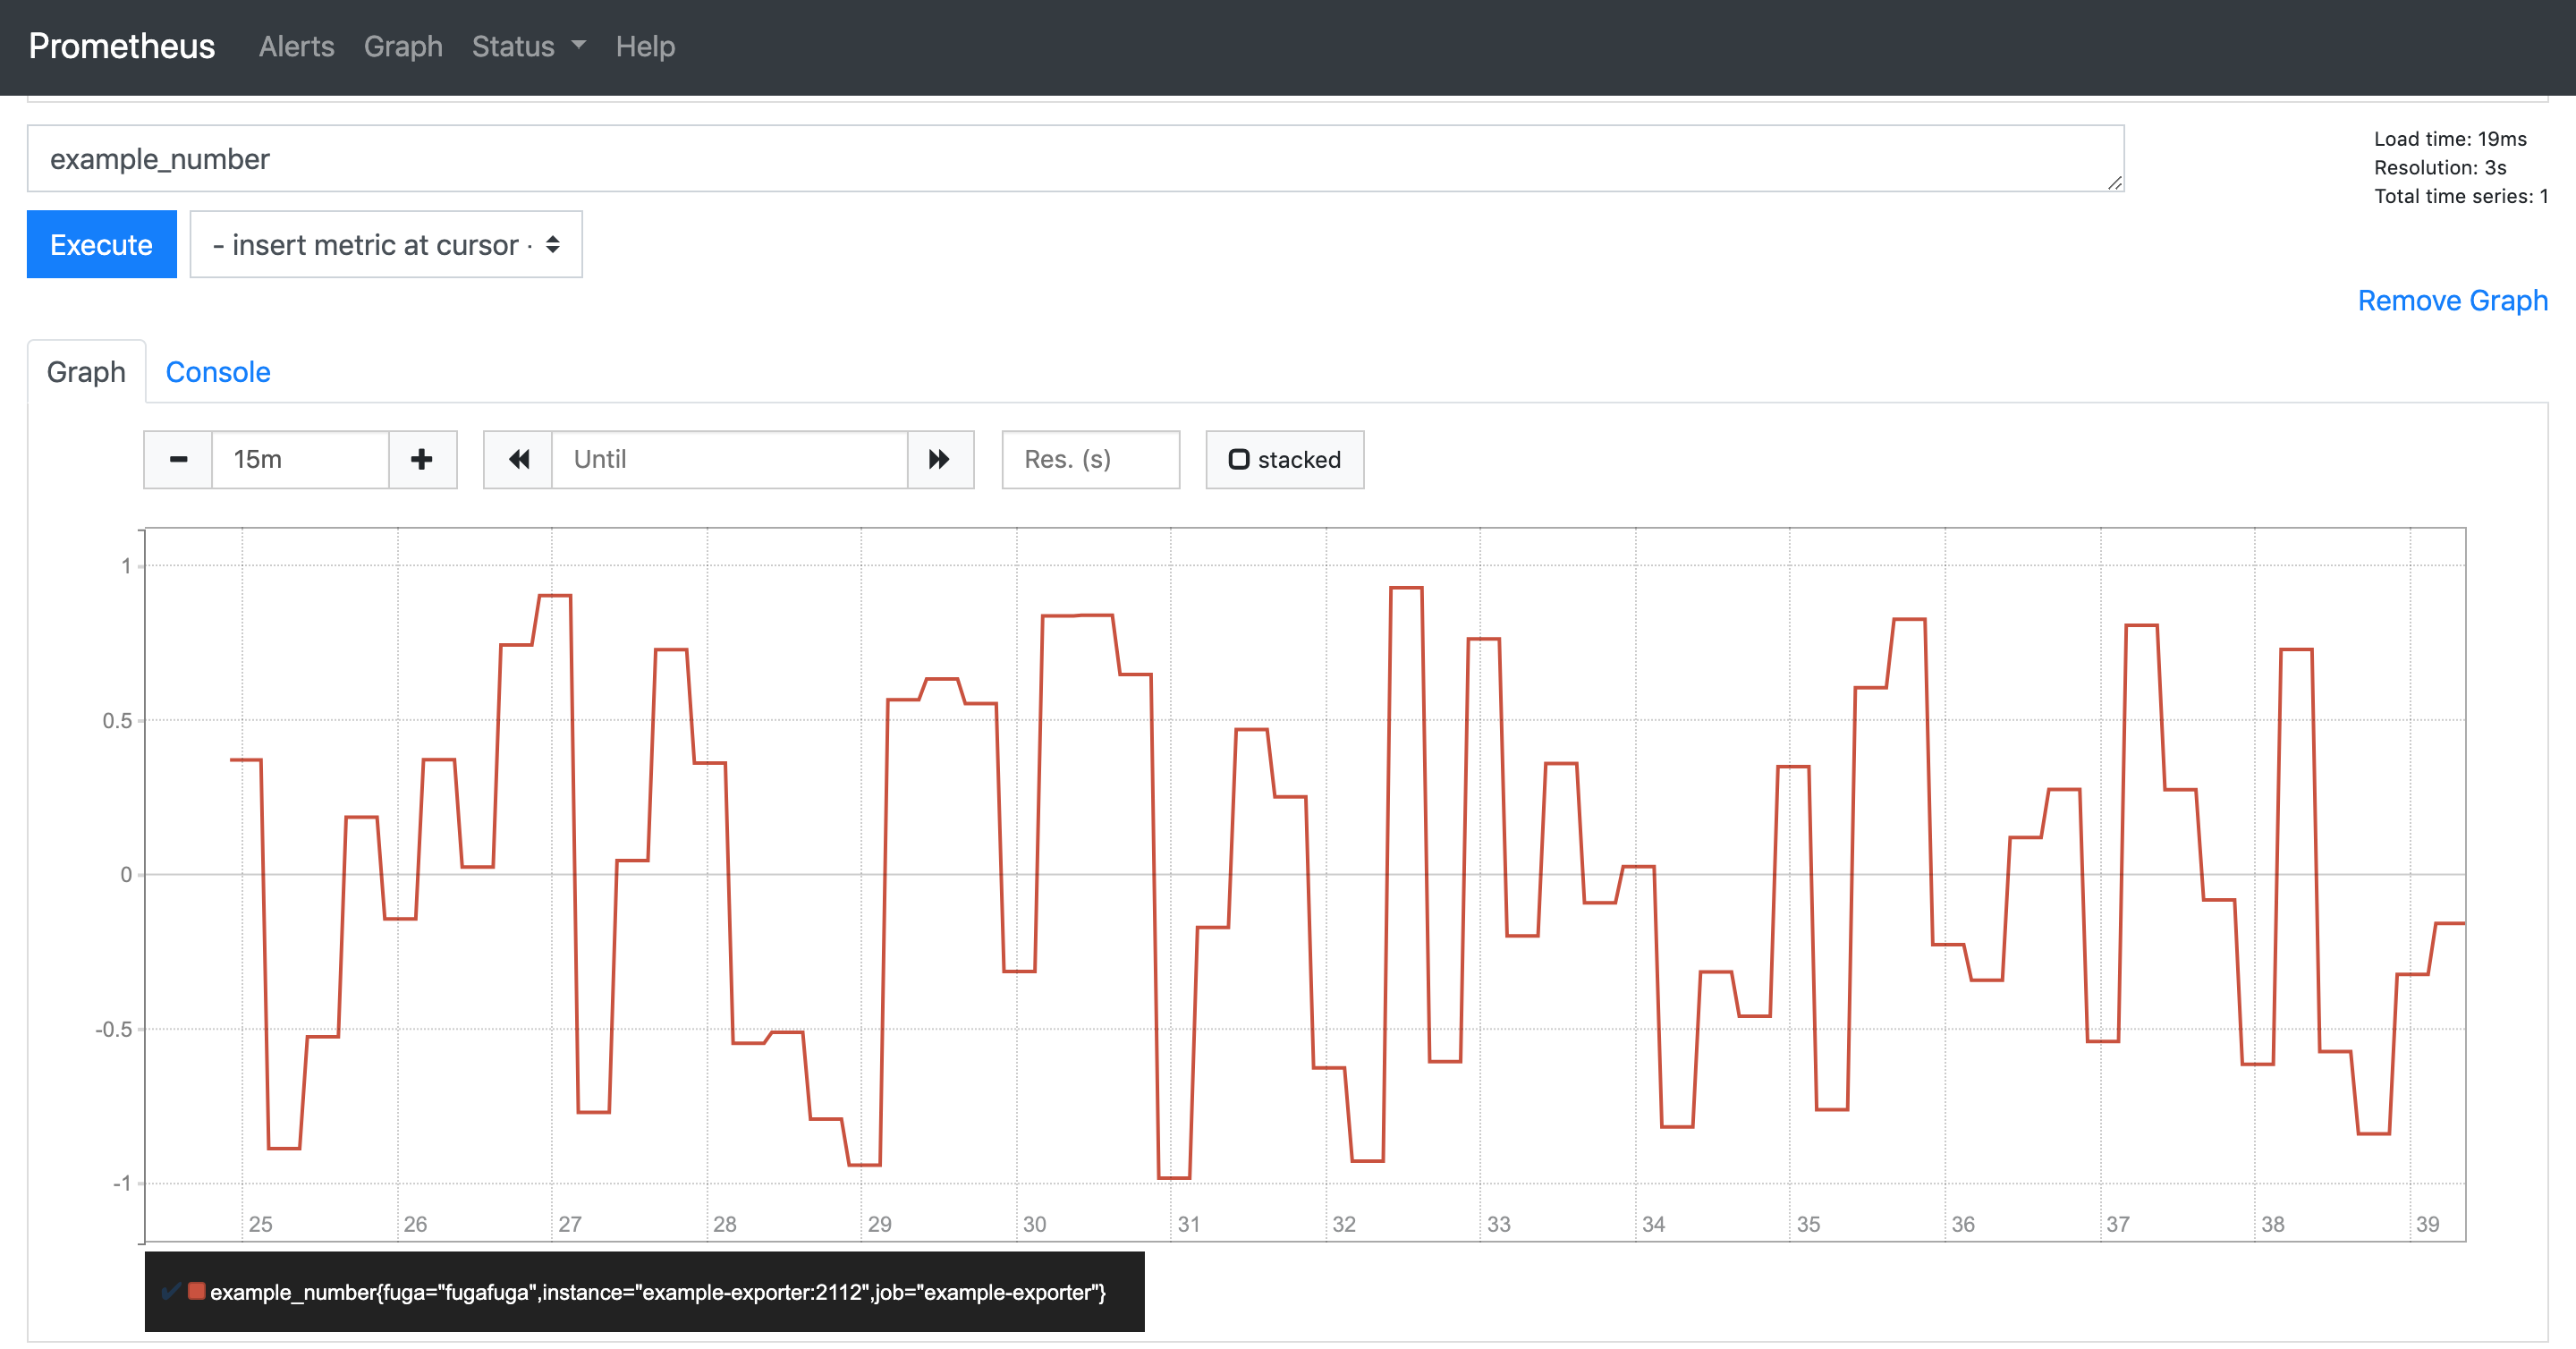
example_number はmain.goで設定した値の変化の間隔(10秒)がPrometheusのscrape_interval(15秒)より短いために15秒ごとに値が変化している.
やったぜ.
自作のExporterをスクレイプして, 設定したとおりにメトリクスが変化していることが確認できた.
おわり
PrometheusでスクレイプできるかんたんなExporterを自作してみた.Prometheus自体がGoで書かれているだけあって, Goだとかなり楽に記述できた. と思う.
特にgo routineのおかげでメトリクスとHTTPハンドラの並行処理が簡単に書けるのがいいと思った.
自作のAPIとかにこんな感じでExporterを実装すれば監視がめちゃめちゃ楽になりそう.
おまけ