監視の練習
ラズパイを使ってPrometheusによる監視の練習をしてみた.
やったことのまとめ
- ラズパイにNode exporterとPrometheusを入れてメトリクスを取れるようにした
- Grafanaも突っ込んでダッシュボードを作ってみた
- 全部サービス化して自動起動するようにした
実際につくったもの.
ラズパイのシステム情報がブラウザから簡単に確認できる.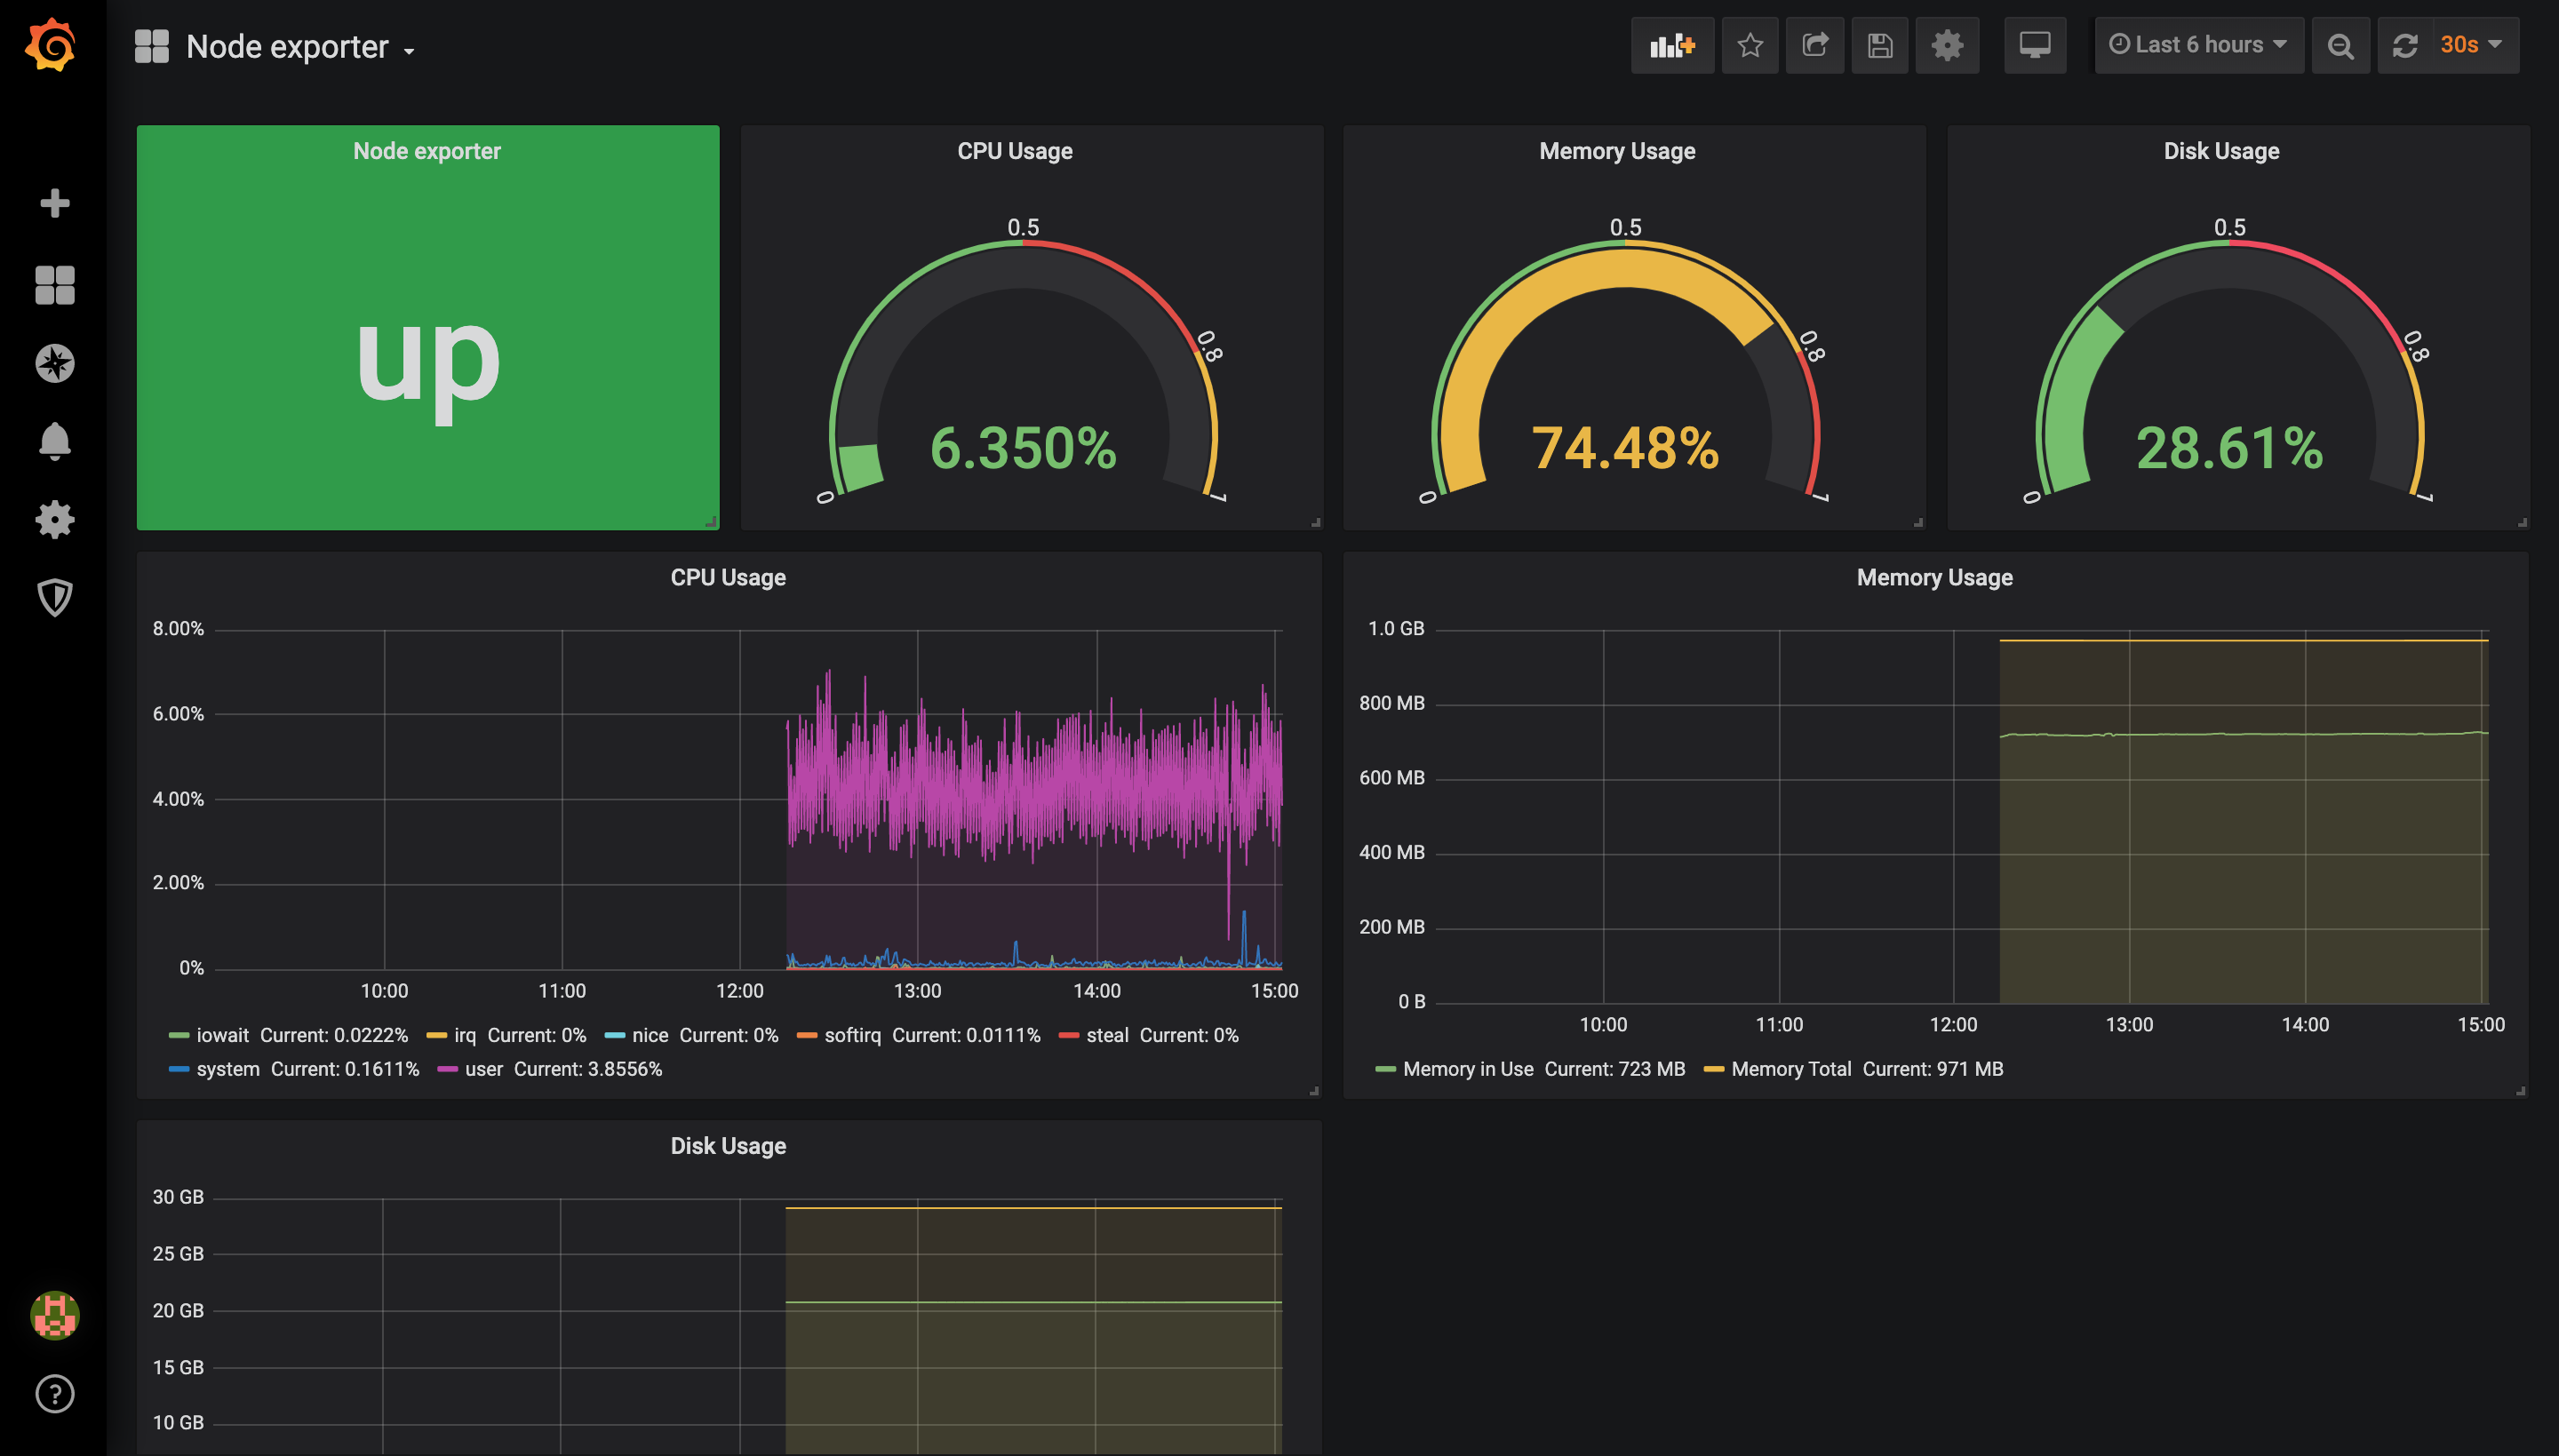
つかうもの
- Raspberry Pi 3 Model B+
- OSはRaspbian(10.0)
- Node exporter
- version=“0.18.1”
- Prometheus
- version=“2.15.2”
- Grafana
- v6.5.2
構成
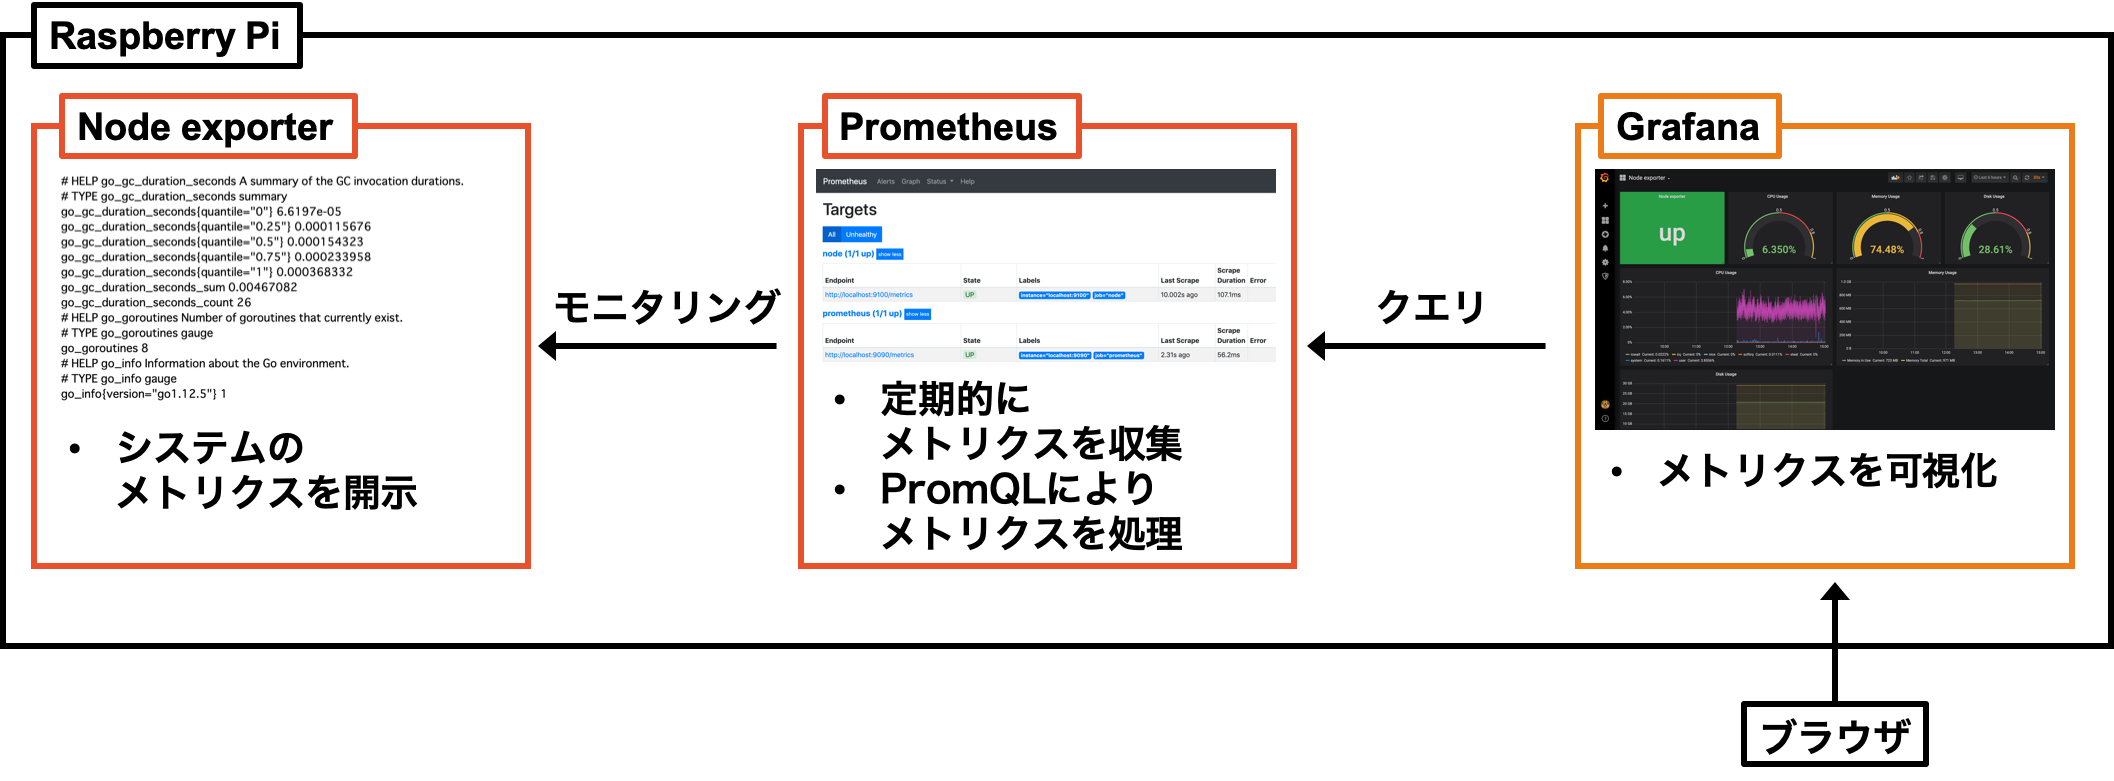
こんな感じの構成でラズパイのシステム情報を可視化する.
Node exporter がマシンのシステム情報(CPU使用率など)を数値化したメトリクスを吐き出し続け,
Prometheus でexporterの吐き出すメトリクスをモニタリングして時系列化.
最後に Grafana が Prometheus の持つ時系列データを取り出して可視化する,
という基本的な構成.
Grafana で可視化したデータは同じネットワークのブラウザから見ることができる.
今回はこれらのコンポーネントを1台のマシンにまとめてしまうが, 複数台のマシンに分散させることも可能である.
やったこと
Node exporterのインストール
まずはNode exporterをインストールする.
ブラウザでPrometheusのダウンロードページを開き, Architectureをarmv7にした状態でnode_exporter-0.18.1.linux-armv7.tar.gzをダウンロードする.
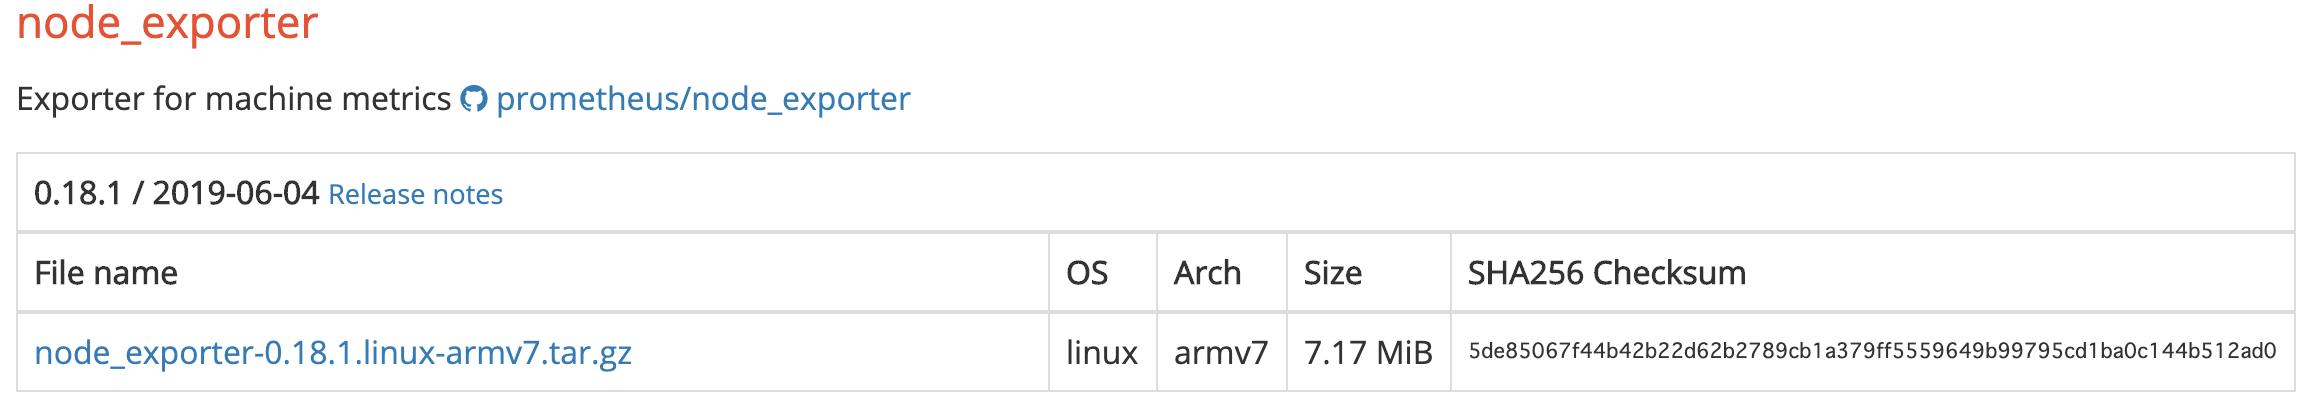
もしくは, コマンドラインからwgetする.
# 任意のディレクトリで実行
$ cd /path/to/workspace

# node_exporterをダウンロードして展開, バイナリを移動
$ wget https://github.com/prometheus/node_exporter/releases/download/v0.18.1/node_exporter-0.18.1.linux-armv7.tar.gz
$ tar -xzf node_exporter-0.18.1.linux-armv7.tar.gz
$ sudo cp node_exporter-0.18.1.linux-armv7/node_exporter /usr/local/bin
動作確認してみる.
# Node exporterを起動
$ /usr/local/bin/node_exporter
INFO[0000] Starting node_exporter (version=0.18.1, branch=HEAD, revision=3db77732e925c08f675d7404a8c46466b2ece83e)  source="node_exporter.go:156"
INFO[0000] Build context (go=go1.12.5, user=root@b50852a1acba, date=20190604-16:42:57)  source="node_exporter.go:157"
INFO[0000] Enabled collectors:                           source="node_exporter.go:97"
INFO[0000]  - arp                                        source="node_exporter.go:104"
...
INFO[0000]  - zfs                                        source="node_exporter.go:104"
INFO[0000] Listening on :9100                            source="node_exporter.go:170"
# 動作確認が終わり次第Ctrl+Cで終了する
9100番ポートで起動しているので, ラズパイか同じネットワークにあるマシンのブラウザから<ラズパイのIP>:9100/metricsを開くと, メトリクスの一覧が表示される.
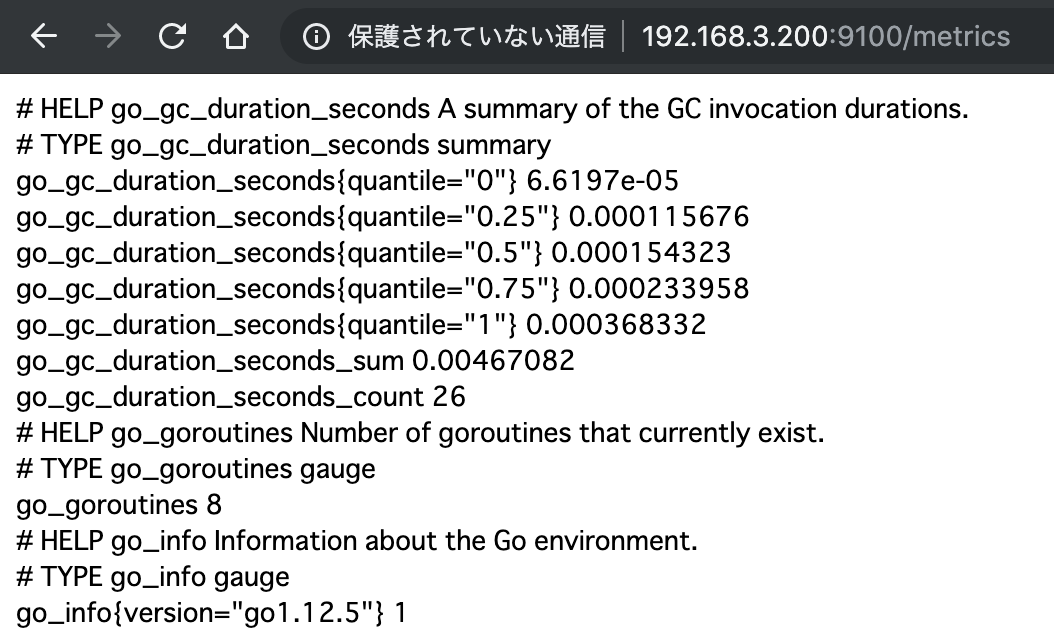
(画像にあるIPは前回固定したもの)
毎回手動で起動するのは不便なのでサービス化しておく.
こちらのサンプルの通りにやってみる.
# service起動に必要なuser(node_exporter)を追加する
$ sudo useradd -U -s /sbin/nologin -M -d / node_exporter

# serviceファイルを作成する
$ sudo vim /etc/systemd/system/node_exporter.service

# serviceの起動
$ sudo systemctl daemon-reload
$ sudo systemctl enable node_exporter
Created symlink /etc/systemd/system/multi-user.target.wants/node_exporter.service → /etc/systemd/system/node_exporter.service.
$ sudo systemctl start node_exporter
$ systemctl status node_exporter
● node_exporter.service - Node Exporter
   Loaded: loaded (/etc/systemd/system/node_exporter.service; enabled; vendor preset: enabled)
   Active: active (running) since Wed 2020-01-15 22:50:41 JST; 3 days ago
 Main PID: 19378 (node_exporter)
    Tasks: 13 (limit: 2200)
   Memory: 17.8M
   CGroup: /system.slice/node_exporter.service
           └─19378 /usr/local/bin/node_exporter
...
Jan 15 22:50:41 raspberrypi node_exporter[19378]: time="2020-01-15T22:50:41+09:00" level=info msg="Listening on :9100" source="node_exporter.go:170"
node_exporter.service
[Unit]
Description=Node Exporter

[Service]
User=node_exporter
ExecStart=/usr/local/bin/node_exporter

[Install]
WantedBy=multi-user.target
(https://github.com/prometheus/node_exporter/blob/master/examples/systemd/node_exporter.service を改変)
これでNode exporterが自動起動するようになった.
動作確認時と同様にブラウザでアクセスしても同じメトリクスが表示される.
Prometheusのインストール
次にPrometheusをインストールする.
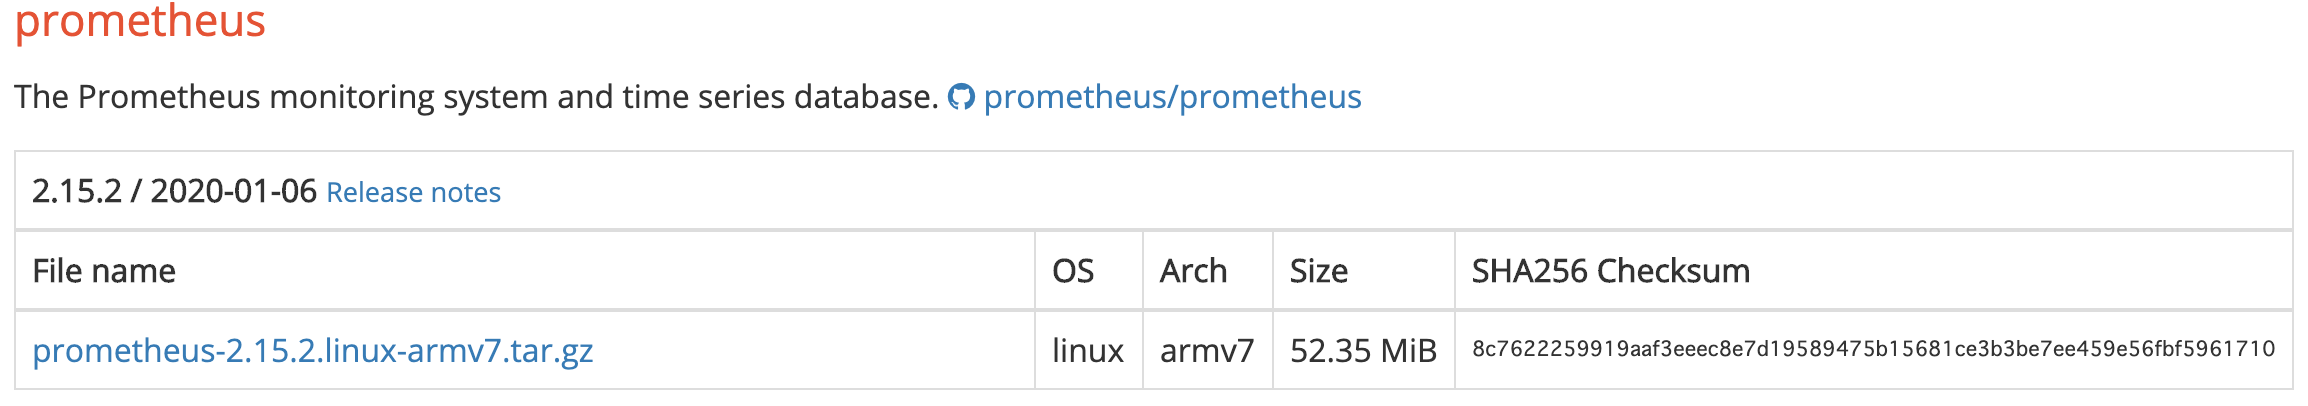
Node exporterと同様にブラウザでPrometheusのダウンロードページを開き, Architectureをarmv7にした状態でprometheus-2.15.2.linux-armv7.tar.gzをダウンロードするか, コマンドラインからwgetする.
# 任意のディレクトリで実行
$ cd /path/to/workspace

# prometheusをダウンロードして展開, 移動
$ wget https://github.com/prometheus/prometheus/releases/download/v2.15.2/prometheus-2.15.2.linux-armv7.tar.gz
$ tar -xzf prometheus-2.15.2.linux-armv7.tar.gz
$ sudo cp -a prometheus-2.15.2.linux-armv7 /usr/local/prometheus
すでに起動中のNode exporterのメトリクスを取得するために設定ファイルを編集し, 動作確認する.
# 設定ファイルを編集
$ sudo vim /usr/local/prometheus/prometheus.yml

# Prometheusを起動
$ /usr/local/prometheus/prometheus --config.file=/usr/local/prometheus/prometheus.yml
level=info ts=2020-01-15T14:14:00.683Z caller=main.go:294 msg="no time or size retention was set so using the default time retention" duration=15d
level=info ts=2020-01-15T14:14:00.684Z caller=main.go:330 msg="Starting Prometheus" version="(version=2.15.2, branch=HEAD, revision=d9613e5c466c6e9de548c4dae1b9aabf9aaf7c57)"
...
level=info ts=2020-01-15T14:14:00.703Z caller=web.go:506 component=web msg="Start listening for connections" address=0.0.0.0:9090
...
level=info ts=2020-01-15T14:14:00.748Z caller=main.go:617 msg="Server is ready to receive web requests."
# 動作確認が終わり次第Ctrl+Cで終了する
prometheus.yaml
global:
  scrape_interval:     15s
  evaluation_interval: 15s

scrape_configs:
  - job_name: 'prometheus'
    static_configs:
    - targets: ['localhost:9090']
  - job_name: 'node'
    static_configs:
    - targets: ['localhost:9100']
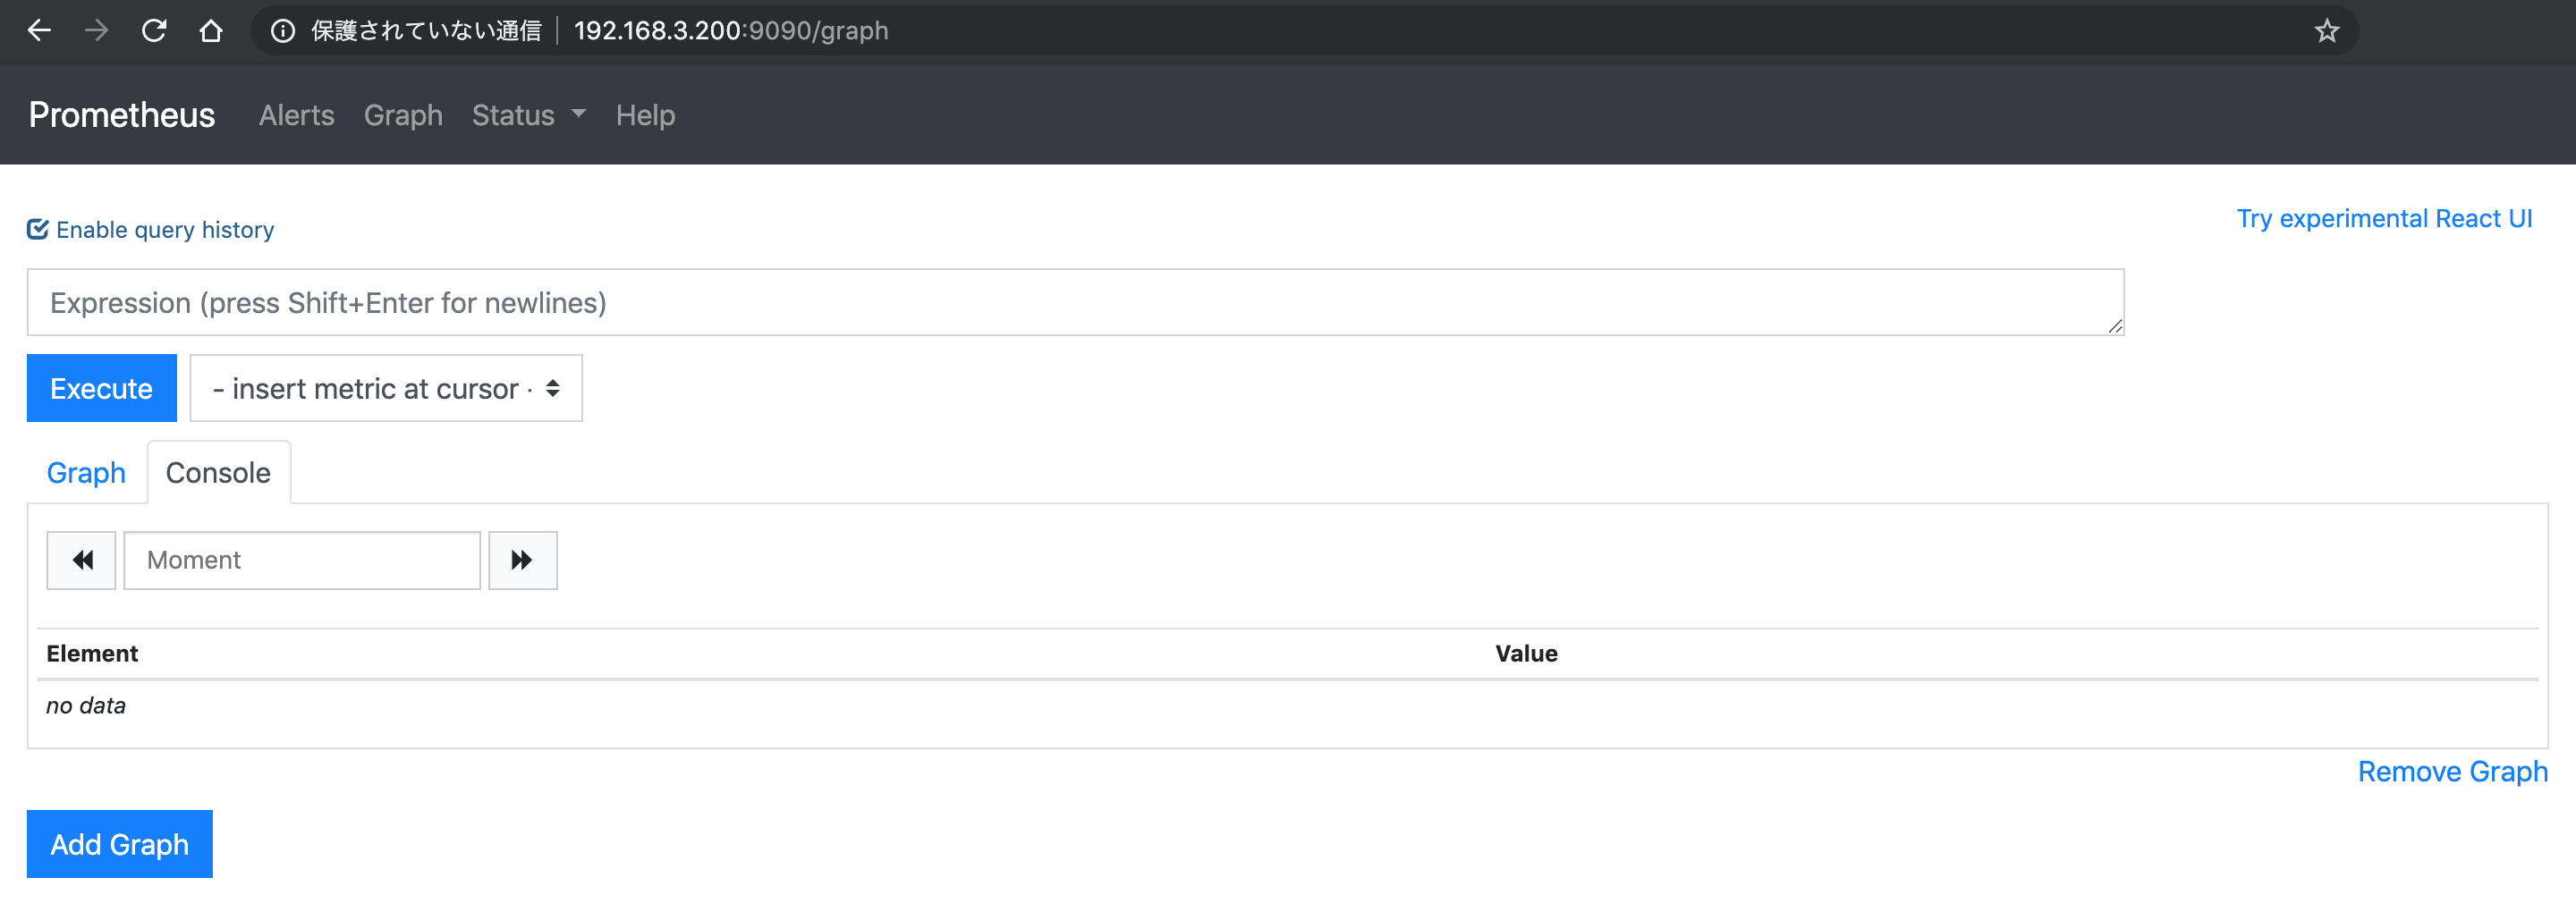
9090番ポートで起動しているので, Node exporterのときと同様に<ラズパイのIP>:9090をブラウザで開く.
PrometheusのUI画面が表示される.
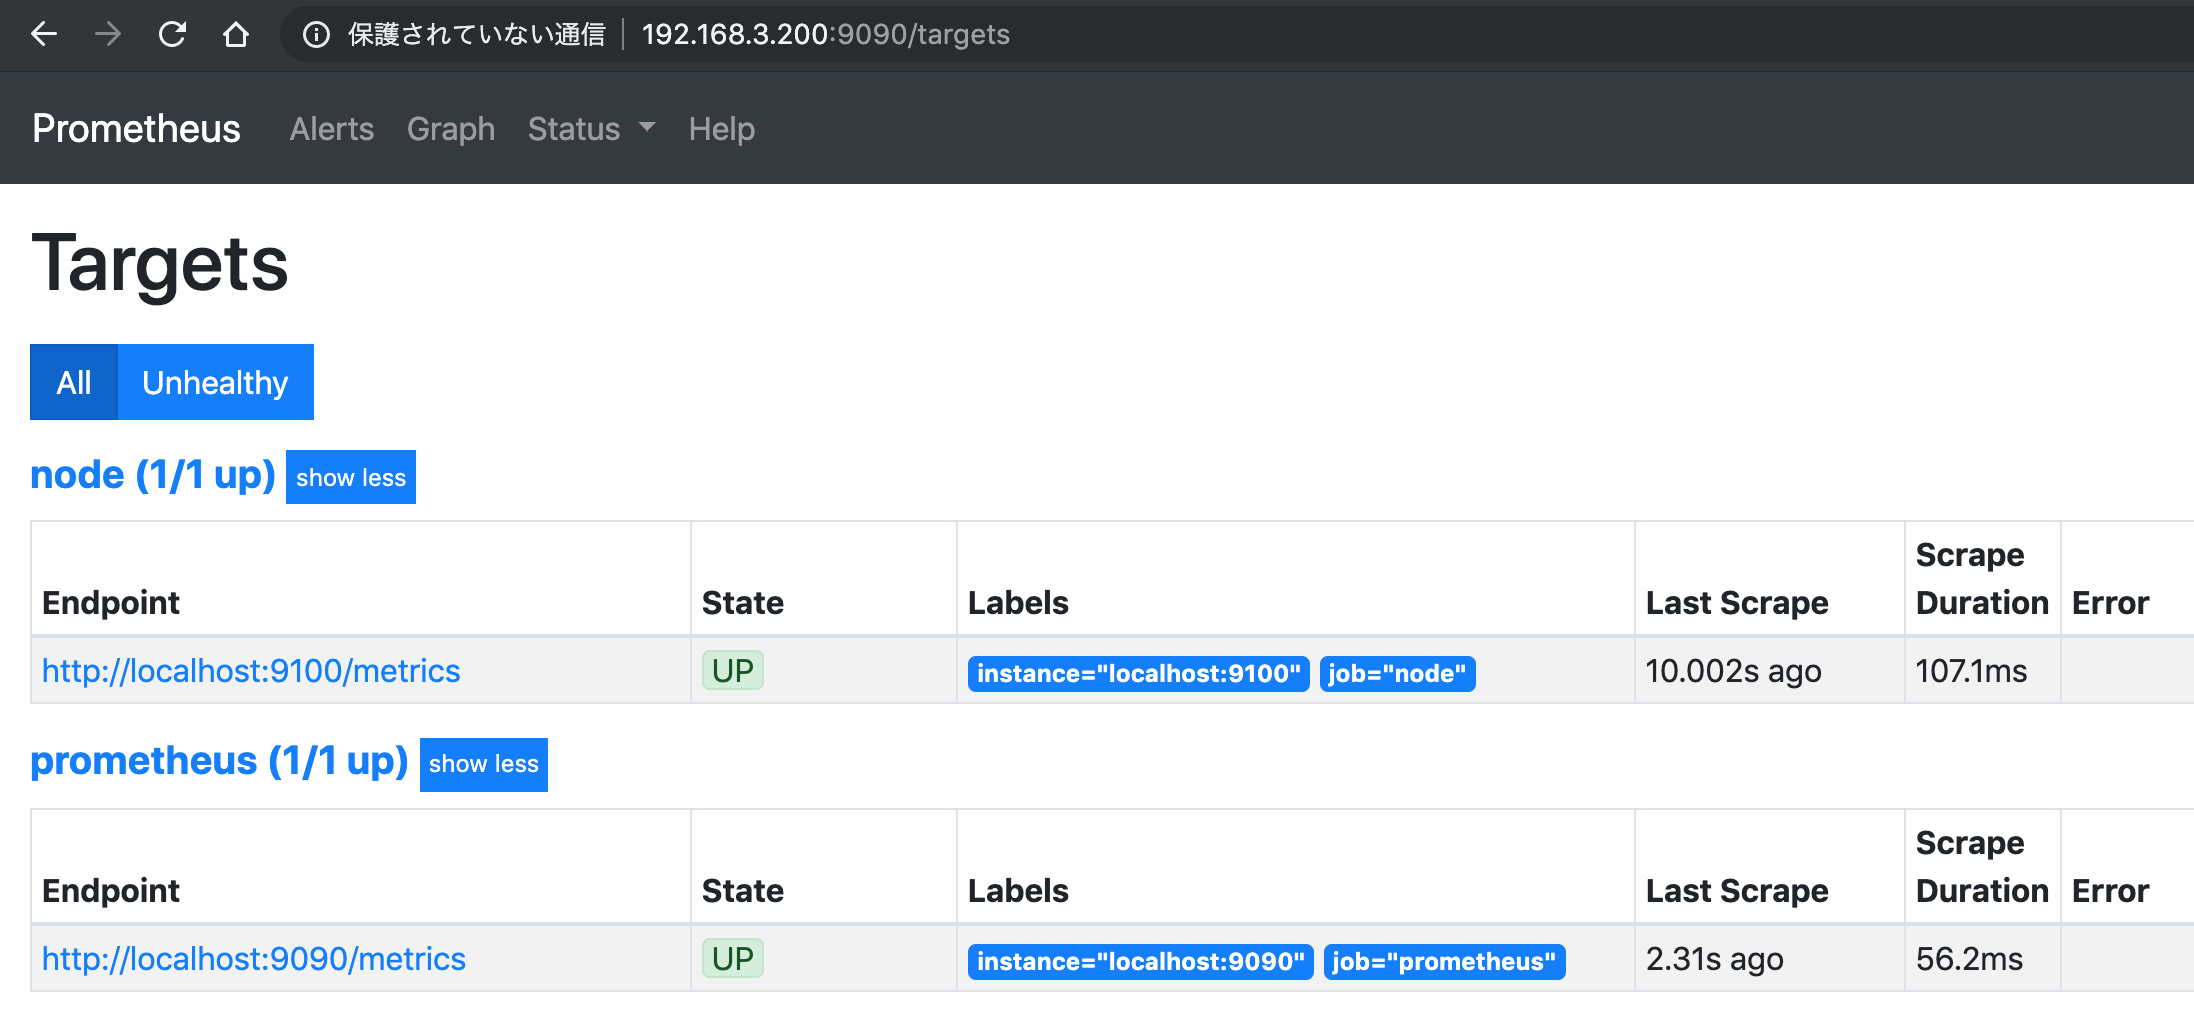
試しにメニューバーからStatus->Targetsと進むとNode exporterのメトリクスをモニタリングしていることがわかる.
こちらもNode exporterと同じようにサービス化する.
# service起動に必要なuser(prometheus)を追加する
$ sudo useradd -U -s /sbin/nologin -M -d / prometheus

# Prometheusが時系列データを保存するためのディレクトリを作成する
$ sudo mkdir -p /var/lib/prometheus/data
$ sudo chown -R prometheus:prometheus /var/lib/prometheus

# serviceファイルを作成する
$ sudo vim /etc/systemd/system/prometheus.service

# serviceの起動
$ sudo systemctl daemon-reload
$ sudo systemctl enable prometheus
Created symlink /etc/systemd/system/multi-user.target.wants/prometheus.service → /etc/systemd/system/prometheus.service.
$ sudo systemctl start prometheus
$ systemctl status prometheus
● prometheus.service - Prometheus Server
   Loaded: loaded (/etc/systemd/system/prometheus.service; enabled; vendor preset: enabled)
   Active: active (running) since Sun 2020-01-19 12:14:50 JST; 14min ago
 Main PID: 20933 (prometheus)
    Tasks: 14 (limit: 2200)
   Memory: 27.8M
   CGroup: /system.slice/prometheus.service
           └─20933 /usr/local/prometheus/prometheus --config.file=/usr/local/prometheus/prometheus.yml --storage.tsdb.path=/var/lib/prometheus/data
...
Jan 19 12:14:51 raspberrypi prometheus[20933]: level=info ts=2020-01-19T03:14:51.079Z caller=web.go:506 component=web msg="Start listening for connections" address=0.0.0.0:9090
...
Jan 19 12:14:51 raspberrypi prometheus[20933]: level=info ts=2020-01-19T03:14:51.125Z caller=main.go:617 msg="Server is ready to receive web requests."
prometheus.service
[Unit]
Description=Prometheus Server

[Service]
User=prometheus
ExecStart=/usr/local/prometheus/prometheus \
  --config.file=/usr/local/prometheus/prometheus.yml \
  --storage.tsdb.path=/var/lib/prometheus/data

[Install]
WantedBy=multi-user.target
これでPrometheusも自動起動するようになった.
Grafanaのインストール
# devファイルからGrafanaをインストール
$ sudo apt-get install -y adduser libfontconfig1
$ wget https://dl.grafana.com/oss/release/grafana_6.5.2_armhf.deb
$ sudo dpkg -i grafana_6.5.2_armhf.deb

# サービスを起動
$ sudo systemctl daemon-reload
$ sudo systemctl enable grafana-server
Synchronizing state of grafana-server.service with SysV service script with /lib/systemd/systemd-sysv-install.
Executing: /lib/systemd/systemd-sysv-install enable grafana-server
Created symlink /etc/systemd/system/multi-user.target.wants/grafana-server.service → /usr/lib/systemd/system/grafana-server.service.
$ sudo systemctl start grafana-server
$ systemctl status grafana-server
● grafana-server.service - Grafana instance
   Loaded: loaded (/usr/lib/systemd/system/grafana-server.service; enabled; vendor preset: enabled)
   Active: active (running) since Tue 2020-01-14 22:24:02 JST; 4 days ago
     Docs: http://docs.grafana.org
 Main PID: 7445 (grafana-server)
    Tasks: 16 (limit: 2200)
   Memory: 29.3M
   CGroup: /system.slice/grafana-server.service
           └─7445 /usr/sbin/grafana-server --config=/etc/grafana/grafana.ini --pidfile=/var/run/grafana/grafana-server.pid --packaging=deb cfg:default.paths.logs=/var/log/grafana cfg:default.paths.data=/v
...
Jan 14 22:24:09 raspberrypi grafana-server[7445]: t=2020-01-14T22:24:09+0900 lvl=info msg="HTTP Server Listen" logger=http.server address=[::]:3000 protocol=http subUrl= socket=
...
3000番ポートで起動しているので, ブラウザで<ラズパイのIP>:3000を開く.
ログイン画面が開かれるので, 初期ID(admin)とパスワード(admin)で入る.
ホームダッシュボードが開かれる.

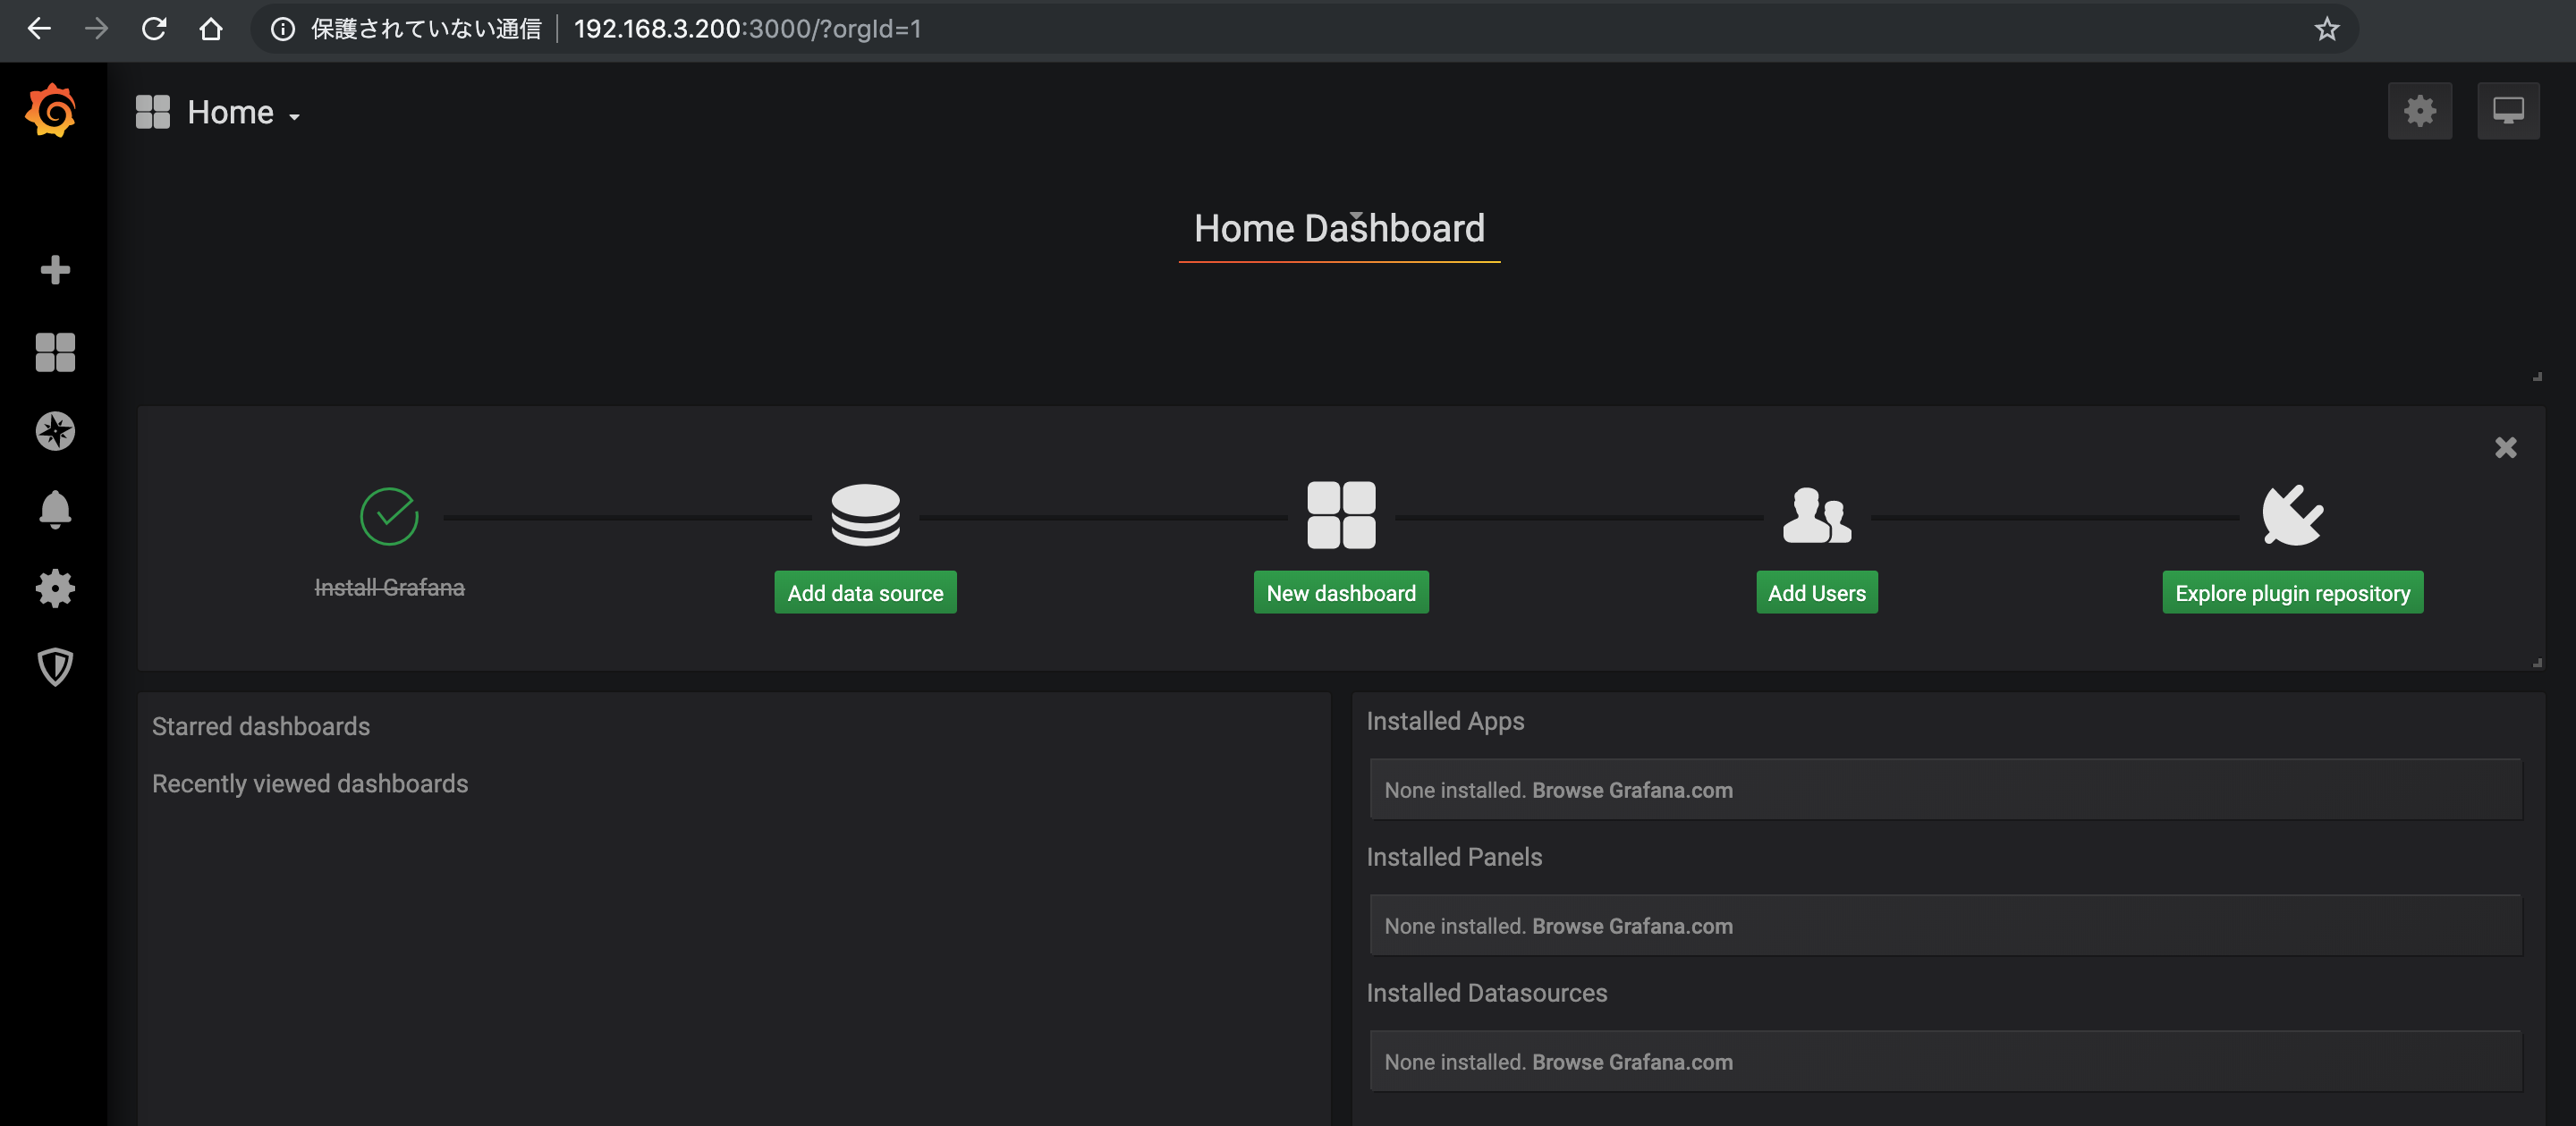
これでGrafanaの立ち上げは完了.
Prometheusのが取得したメトリクスを読めるようにdata sourceの設定を行う.
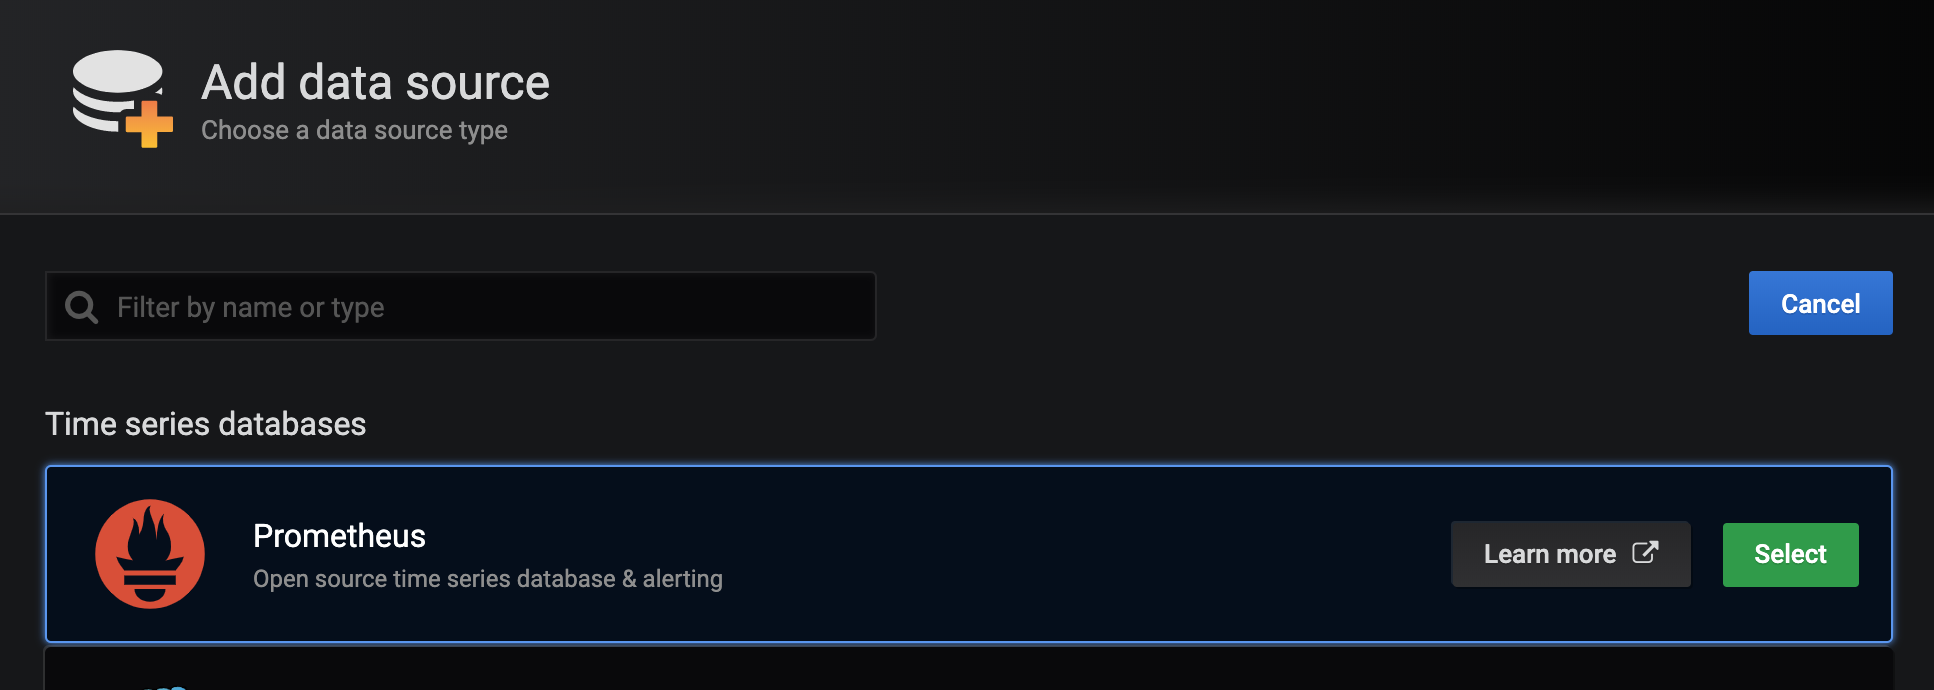
ホームダッシュボードのAdd data sourceを開き, Prometheusを選択する.
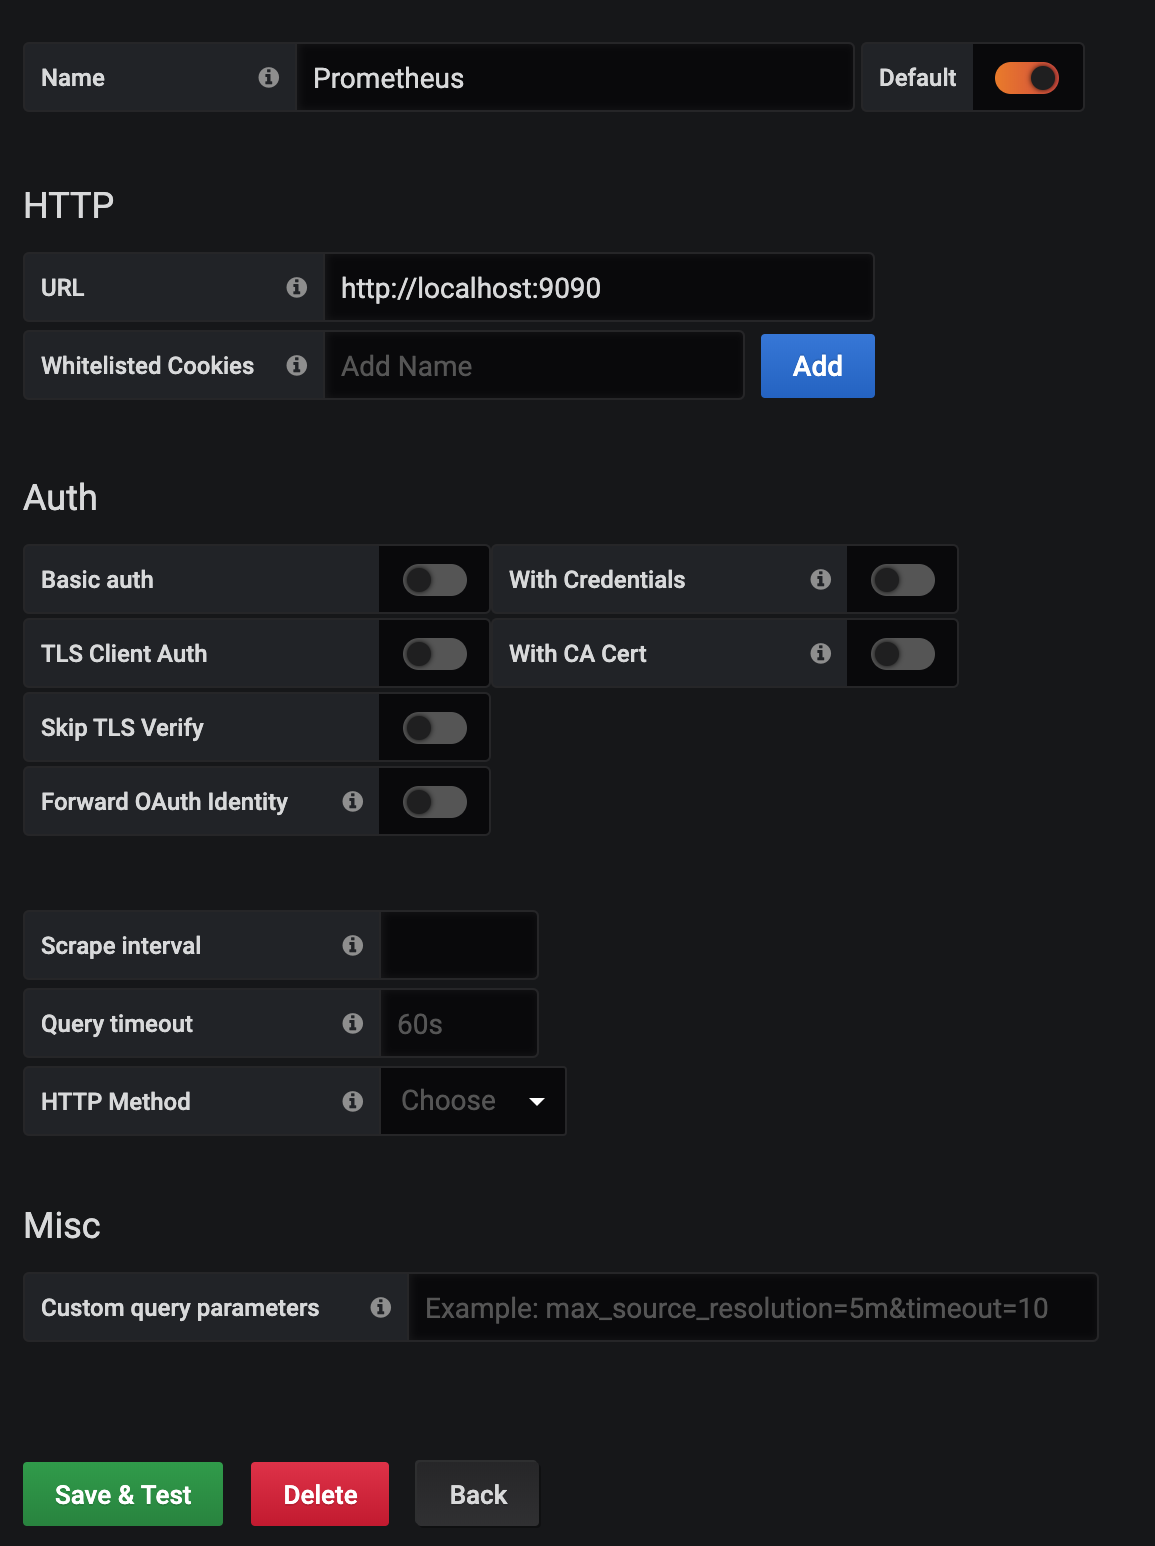
設定画面でPrometheusのURL(http://localhost:9090)を入力し, Save & Testを押すとPrometheusが登録される.
次はダッシュボードを作る.
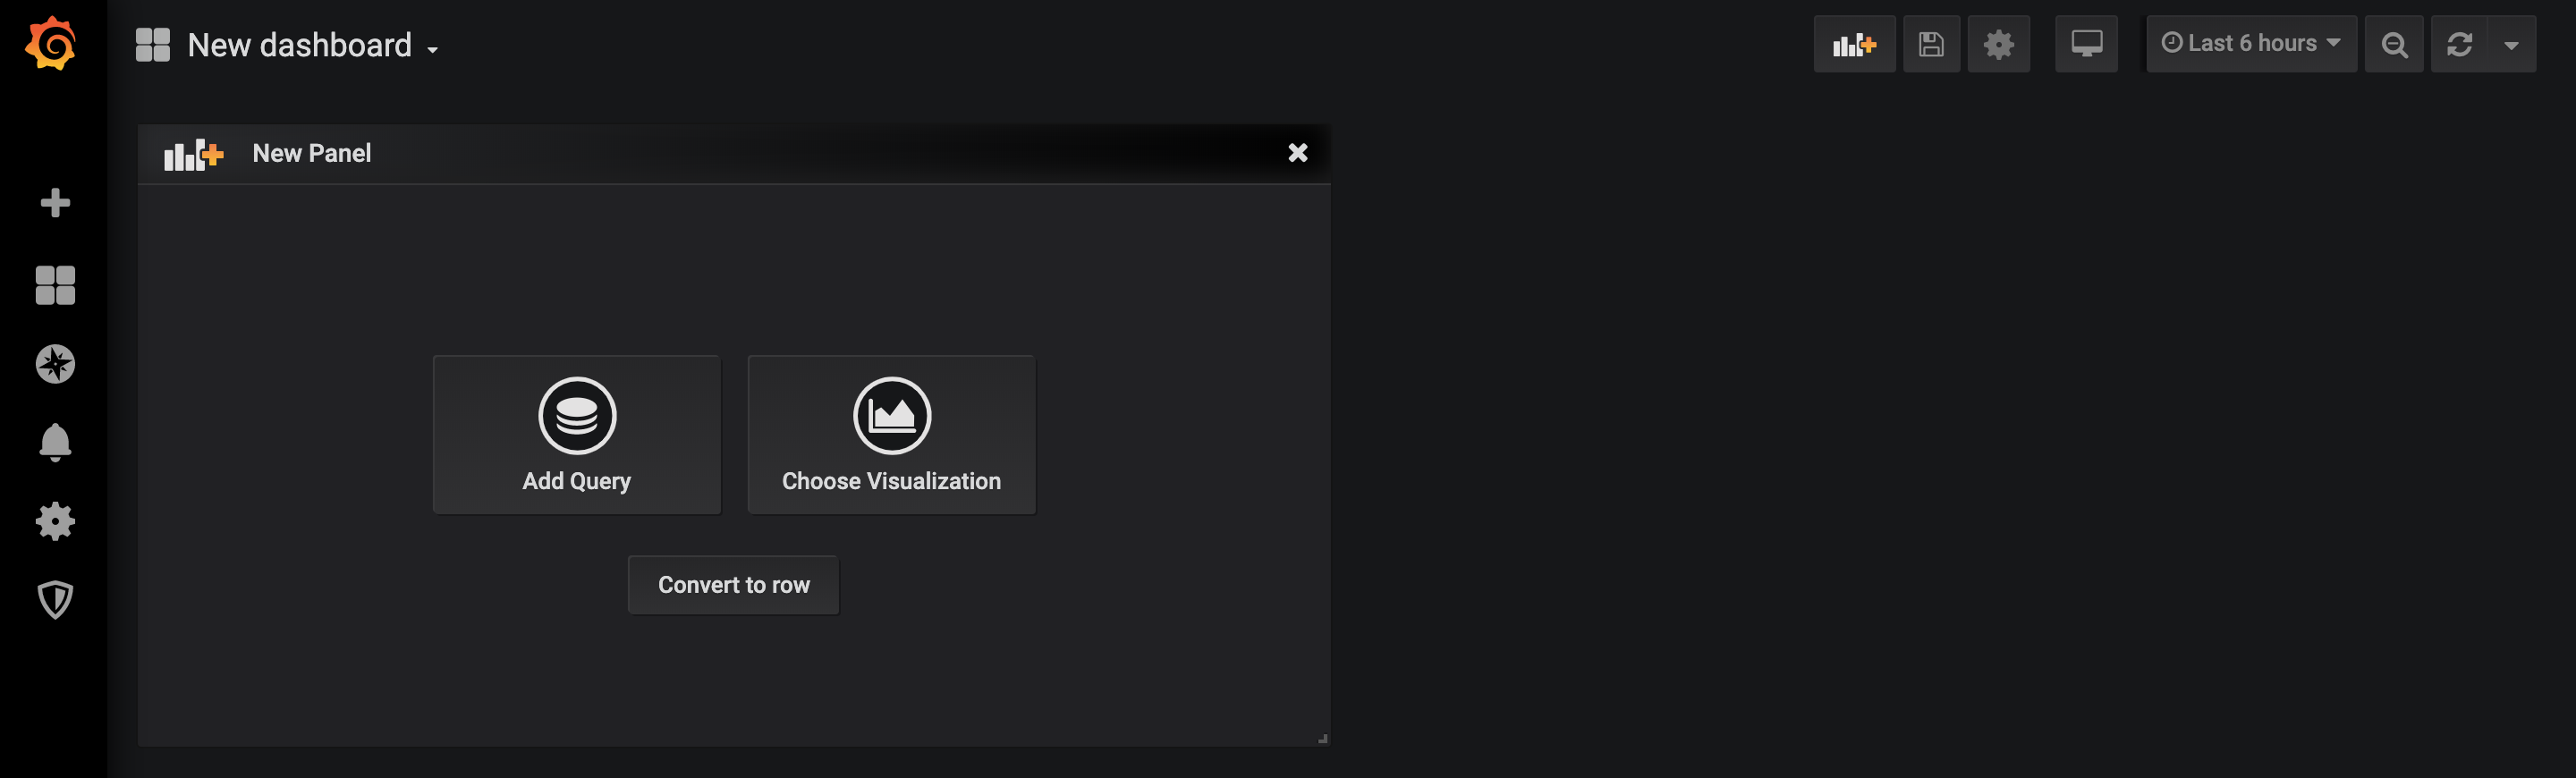
ホームダッシュボードのNew dashboardを開き, Add Queryを選択する.
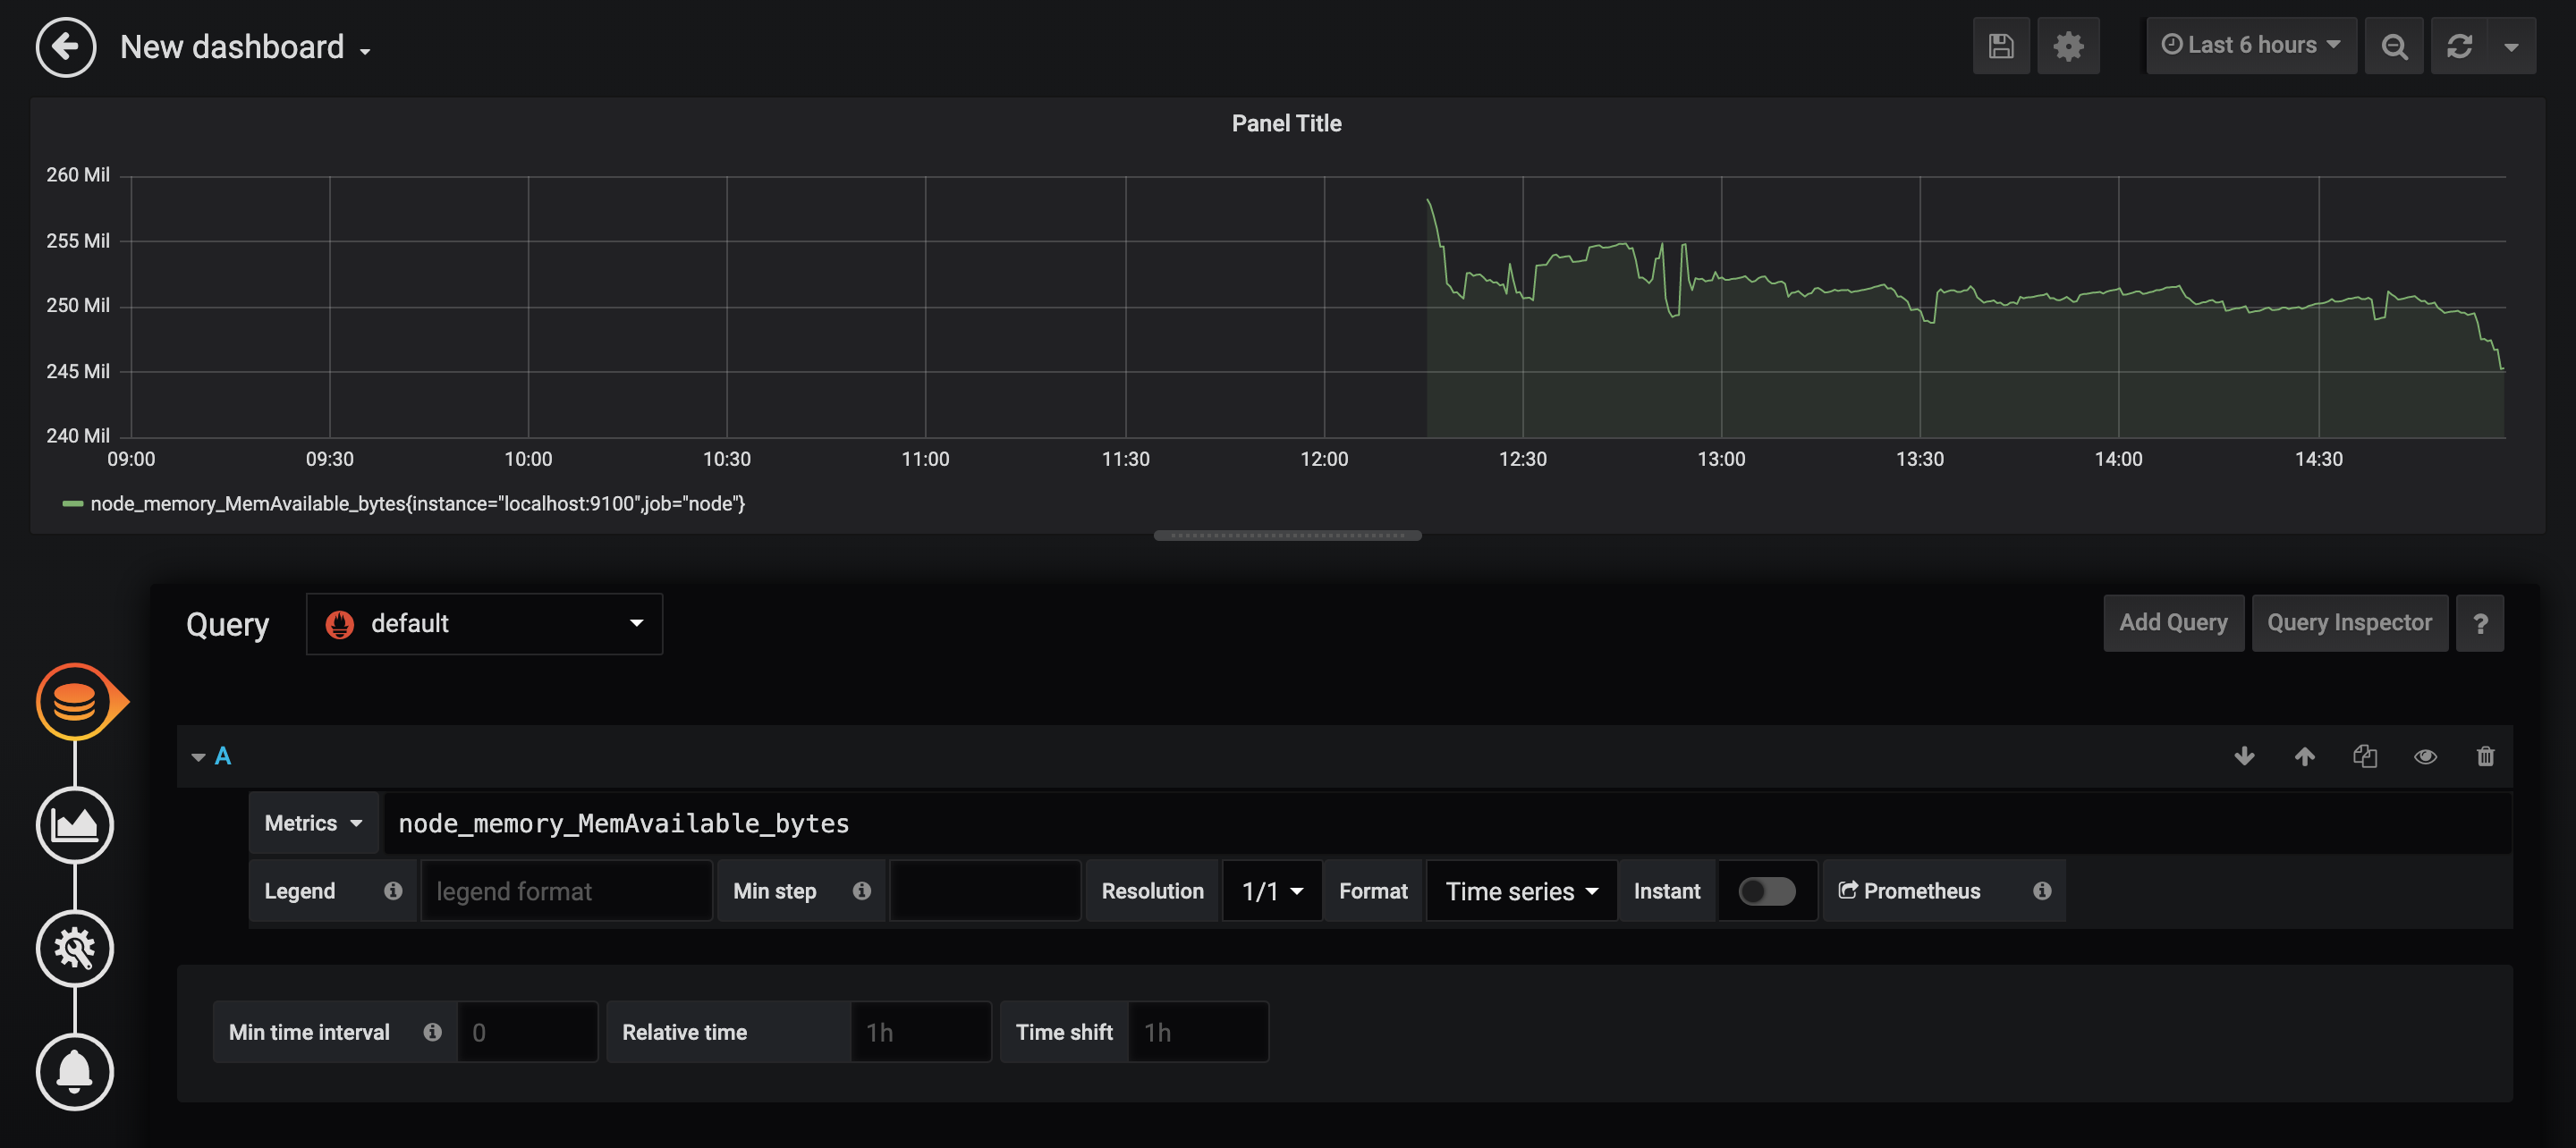
編集画面で試しにメモリの空きを表すメトリクス名node_memory_MemAvailable_bytesを入力すると, その時系列データがグラフ化される.
すごい.
他にもPromQLとGrafanaの機能をいじり始めると楽しくて時間が飛ぶので割愛するが,
同様にしてPrometheusが取得した各種メトリクスをグラフ化することができる.
下の画像は今回作ったダッシュボードのスクリーンショットで,
CPU使用率, メモリ使用率, ディスク使用率などが可視化されている.
ダッシュボードをJSON形式で出力したもの
{
  "annotations": {
    "list": [
      {
        "builtIn": 1,
        "datasource": "-- Grafana --",
        "enable": true,
        "hide": true,
        "iconColor": "rgba(0, 211, 255, 1)",
        "name": "Annotations & Alerts",
        "type": "dashboard"
      }
    ]
  },
  "editable": true,
  "gnetId": null,
  "graphTooltip": 0,
  "id": 4,
  "links": [],
  "panels": [
    {
      "cacheTimeout": null,
      "colorBackground": true,
      "colorPrefix": false,
      "colorValue": false,
      "colors": [
        "#d44a3a",
        "rgba(237, 129, 40, 0.89)",
        "#299c46"
      ],
      "datasource": null,
      "format": "none",
      "gauge": {
        "maxValue": 100,
        "minValue": 0,
        "show": false,
        "thresholdLabels": false,
        "thresholdMarkers": true
      },
      "gridPos": {
        "h": 6,
        "w": 6,
        "x": 0,
        "y": 0
      },
      "id": 14,
      "interval": null,
      "links": [],
      "mappingType": 1,
      "mappingTypes": [
        {
          "name": "value to text",
          "value": 1
        },
        {
          "name": "range to text",
          "value": 2
        }
      ],
      "maxDataPoints": 100,
      "nullPointMode": "connected",
      "nullText": null,
      "options": {},
      "postfix": "",
      "postfixFontSize": "50%",
      "prefix": "",
      "prefixFontSize": "50%",
      "rangeMaps": [
        {
          "from": "null",
          "text": "N/A",
          "to": "null"
        }
      ],
      "sparkline": {
        "fillColor": "rgba(31, 118, 189, 0.18)",
        "full": false,
        "lineColor": "rgb(31, 120, 193)",
        "show": false,
        "ymax": null,
        "ymin": null
      },
      "tableColumn": "",
      "targets": [
        {
          "expr": "up{job=\"node\"}",
          "refId": "A"
        }
      ],
      "thresholds": "0.1, 0.9",
      "timeFrom": null,
      "timeShift": null,
      "title": "Node exporter",
      "type": "singlestat",
      "valueFontSize": "200%",
      "valueMaps": [
        {
          "op": "=",
          "text": "N/A",
          "value": "null"
        },
        {
          "op": "=",
          "text": "down",
          "value": "0"
        },
        {
          "op": "=",
          "text": "up",
          "value": "1"
        }
      ],
      "valueName": "current"
    },
    {
      "datasource": null,
      "gridPos": {
        "h": 6,
        "w": 6,
        "x": 6,
        "y": 0
      },
      "id": 8,
      "options": {
        "fieldOptions": {
          "calcs": [
            "last"
          ],
          "defaults": {
            "mappings": [],
            "max": 1,
            "min": 0,
            "thresholds": [
              {
                "color": "green",
                "value": null
              },
              {
                "color": "#E24D42",
                "value": 0.5
              },
              {
                "color": "#EAB839",
                "value": 0.8
              }
            ],
            "unit": "percentunit"
          },
          "override": {},
          "values": false
        },
        "orientation": "auto",
        "showThresholdLabels": true,
        "showThresholdMarkers": true
      },
      "pluginVersion": "6.5.2",
      "targets": [
        {
          "expr": "1.0 - (avg without(cpu) (rate(node_cpu_seconds_total{mode=\"idle\"}[1m])))",
          "refId": "A"
        }
      ],
      "timeFrom": null,
      "timeShift": null,
      "title": "CPU Usage",
      "type": "gauge"
    },
    {
      "cacheTimeout": null,
      "datasource": null,
      "gridPos": {
        "h": 6,
        "w": 6,
        "x": 12,
        "y": 0
      },
      "id": 6,
      "links": [],
      "options": {
        "fieldOptions": {
          "calcs": [
            "last"
          ],
          "defaults": {
            "links": [],
            "mappings": [],
            "max": 1,
            "min": 0,
            "nullValueMode": "connected",
            "thresholds": [
              {
                "color": "green",
                "value": null
              },
              {
                "color": "#EAB839",
                "value": 0.5
              },
              {
                "color": "#E24D42",
                "value": 0.8
              }
            ],
            "title": "",
            "unit": "percentunit"
          },
          "override": {},
          "values": false
        },
        "orientation": "horizontal",
        "showThresholdLabels": true,
        "showThresholdMarkers": true
      },
      "pluginVersion": "6.5.2",
      "targets": [
        {
          "expr": "(node_memory_MemTotal_bytes - node_memory_MemAvailable_bytes) / node_memory_MemTotal_bytes",
          "instant": false,
          "refId": "A"
        }
      ],
      "timeFrom": null,
      "timeShift": null,
      "title": "Memory Usage",
      "type": "gauge"
    },
    {
      "datasource": null,
      "gridPos": {
        "h": 6,
        "w": 6,
        "x": 18,
        "y": 0
      },
      "id": 12,
      "options": {
        "fieldOptions": {
          "calcs": [
            "last"
          ],
          "defaults": {
            "mappings": [],
            "max": 1,
            "min": 0,
            "thresholds": [
              {
                "color": "green",
                "value": null
              },
              {
                "color": "red",
                "value": 0.5
              },
              {
                "color": "#EAB839",
                "value": 0.8
              }
            ],
            "unit": "percentunit"
          },
          "override": {},
          "values": false
        },
        "orientation": "auto",
        "showThresholdLabels": true,
        "showThresholdMarkers": true
      },
      "pluginVersion": "6.5.2",
      "targets": [
        {
          "expr": "1 - (node_filesystem_avail_bytes{mountpoint=\"/\"} / node_filesystem_size_bytes{mountpoint=\"/\"})",
          "refId": "A"
        }
      ],
      "timeFrom": null,
      "timeShift": null,
      "title": "Disk Usage",
      "type": "gauge"
    },
    {
      "aliasColors": {},
      "bars": false,
      "dashLength": 10,
      "dashes": false,
      "datasource": null,
      "fill": 1,
      "fillGradient": 0,
      "gridPos": {
        "h": 8,
        "w": 12,
        "x": 0,
        "y": 6
      },
      "hiddenSeries": false,
      "id": 2,
      "legend": {
        "avg": false,
        "current": true,
        "max": false,
        "min": false,
        "show": true,
        "total": false,
        "values": true
      },
      "lines": true,
      "linewidth": 1,
      "nullPointMode": "null",
      "options": {
        "dataLinks": []
      },
      "percentage": false,
      "pointradius": 2,
      "points": false,
      "renderer": "flot",
      "seriesOverrides": [],
      "spaceLength": 10,
      "stack": false,
      "steppedLine": false,
      "targets": [
        {
          "expr": "avg without(cpu) (rate(node_cpu_seconds_total{mode!=\"idle\"}[1m]))",
          "legendFormat": "{{mode}}",
          "refId": "A"
        }
      ],
      "thresholds": [],
      "timeFrom": null,
      "timeRegions": [],
      "timeShift": null,
      "title": "CPU Usage",
      "tooltip": {
        "shared": true,
        "sort": 0,
        "value_type": "individual"
      },
      "type": "graph",
      "xaxis": {
        "buckets": null,
        "mode": "time",
        "name": null,
        "show": true,
        "values": []
      },
      "yaxes": [
        {
          "format": "percentunit",
          "label": null,
          "logBase": 1,
          "max": null,
          "min": null,
          "show": true
        },
        {
          "format": "short",
          "label": null,
          "logBase": 1,
          "max": null,
          "min": null,
          "show": true
        }
      ],
      "yaxis": {
        "align": false,
        "alignLevel": null
      }
    },
    {
      "aliasColors": {},
      "bars": false,
      "dashLength": 10,
      "dashes": false,
      "datasource": null,
      "fill": 1,
      "fillGradient": 0,
      "gridPos": {
        "h": 8,
        "w": 12,
        "x": 12,
        "y": 6
      },
      "hiddenSeries": false,
      "id": 4,
      "legend": {
        "avg": false,
        "current": true,
        "max": false,
        "min": false,
        "show": true,
        "total": false,
        "values": true
      },
      "lines": true,
      "linewidth": 1,
      "nullPointMode": "null",
      "options": {
        "dataLinks": []
      },
      "percentage": false,
      "pointradius": 2,
      "points": false,
      "renderer": "flot",
      "seriesOverrides": [],
      "spaceLength": 10,
      "stack": false,
      "steppedLine": false,
      "targets": [
        {
          "expr": "node_memory_MemTotal_bytes - node_memory_MemAvailable_bytes",
          "instant": false,
          "intervalFactor": 1,
          "legendFormat": "Memory in Use",
          "refId": "A"
        },
        {
          "expr": "node_memory_MemTotal_bytes",
          "legendFormat": "Memory Total",
          "refId": "B"
        }
      ],
      "thresholds": [],
      "timeFrom": null,
      "timeRegions": [],
      "timeShift": null,
      "title": "Memory Usage",
      "tooltip": {
        "shared": true,
        "sort": 0,
        "value_type": "individual"
      },
      "type": "graph",
      "xaxis": {
        "buckets": null,
        "mode": "time",
        "name": null,
        "show": true,
        "values": []
      },
      "yaxes": [
        {
          "format": "decbytes",
          "label": null,
          "logBase": 1,
          "max": null,
          "min": "0",
          "show": true
        },
        {
          "format": "short",
          "label": null,
          "logBase": 1,
          "max": null,
          "min": null,
          "show": true
        }
      ],
      "yaxis": {
        "align": false,
        "alignLevel": null
      }
    },
    {
      "aliasColors": {},
      "bars": false,
      "dashLength": 10,
      "dashes": false,
      "datasource": null,
      "fill": 1,
      "fillGradient": 0,
      "gridPos": {
        "h": 8,
        "w": 12,
        "x": 0,
        "y": 14
      },
      "hiddenSeries": false,
      "id": 10,
      "legend": {
        "avg": false,
        "current": false,
        "max": false,
        "min": false,
        "show": true,
        "total": false,
        "values": false
      },
      "lines": true,
      "linewidth": 1,
      "nullPointMode": "null",
      "options": {
        "dataLinks": []
      },
      "percentage": false,
      "pointradius": 2,
      "points": false,
      "renderer": "flot",
      "seriesOverrides": [],
      "spaceLength": 10,
      "stack": false,
      "steppedLine": false,
      "targets": [
        {
          "expr": "node_filesystem_avail_bytes{mountpoint=\"/\"}",
          "refId": "A"
        },
        {
          "expr": "node_filesystem_size_bytes{mountpoint=\"/\"}",
          "refId": "B"
        }
      ],
      "thresholds": [],
      "timeFrom": null,
      "timeRegions": [],
      "timeShift": null,
      "title": "Disk Usage",
      "tooltip": {
        "shared": true,
        "sort": 0,
        "value_type": "individual"
      },
      "type": "graph",
      "xaxis": {
        "buckets": null,
        "mode": "time",
        "name": null,
        "show": true,
        "values": []
      },
      "yaxes": [
        {
          "format": "decbytes",
          "label": null,
          "logBase": 1,
          "max": null,
          "min": "0",
          "show": true
        },
        {
          "format": "short",
          "label": null,
          "logBase": 1,
          "max": null,
          "min": null,
          "show": true
        }
      ],
      "yaxis": {
        "align": false,
        "alignLevel": null
      }
    }
  ],
  "refresh": "30s",
  "schemaVersion": 21,
  "style": "dark",
  "tags": [],
  "templating": {
    "list": []
  },
  "time": {
    "from": "now-6h",
    "to": "now"
  },
  "timepicker": {
    "refresh_intervals": [
      "5s",
      "10s",
      "30s",
      "1m",
      "5m",
      "15m",
      "30m",
      "1h",
      "2h",
      "1d"
    ]
  },
  "timezone": "",
  "title": "Node exporter",
  "uid": "JuC2wgWgk",
  "version": 22
}
やったぜ.
おわり
Node exporterが吐き出したメトリクスをPrometheusで収集し,
それをGrafanaでグラフ化するまでの流れをラズパイで試すことができた.
オタクなのでいろんな情報が1つのダッシュボードに表示されていると気持ちよくなってしまう…
Grafanaは色んな意味で時間泥棒.
後で気が向いたらAlertmanagerを入れてみる.
おまけ